Nazar Babenko 🇺🇦 retweetledi

Four years since russia’s full-scale invasion of 🇺🇦Ukraine.
Four years of resistance, resilience, and courage.

English
Nazar Babenko 🇺🇦
229 posts

@wellenborg
Product Manager @StreamsCharts. Helping brands, agencies & creators to get detailed streaming data. Formerly @esportalSE 🔫 Email: [email protected]


🚀 Our whitepaper, The Hidden Cost of Viewbotting, is OUT NOW! What’s inside: 📊Latest data on fake viewership ✍️Actionable insights for marketers 🤬Proven detection methods and business risks 🟣Exclusive statements from @Twitch 📩Download your copy: streamscharts.com/reports/viewbo…


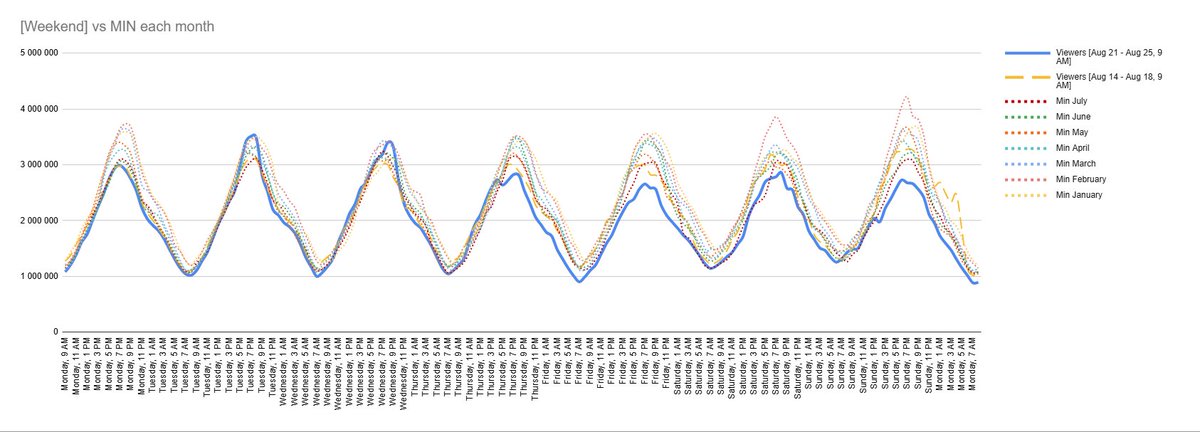
Thank you for your opinion, Barry, I really appreciate that from someone who understands statistics. It was simply easier to provide specific examples with week-to-week comparison for public interpretation, but I agree that this does not justify my team. And fully agree that week-to-week comparisons alone can be misleading if taken out of broader context — that’s why, behind the scenes, we didn’t limit our analysis to just two weeks. What we actually did in the lab: 1) Looked at the entire year of 2025, comparing week over week trends, not just Aug 14–28. 2) Controlled for natural fluctuations like collabs, events, and seasonal shifts by comparing against monthly minimum baselines. 3) Found that Mon–Thu (Aug 18–21) tracked normally and aligned with prior weeks. 4) But starting Aug 22, trends diverged: the following weekend dropped below the hourly minimum of every month in 2025 (see chart attached). 5) No other week this year registered declines this deep — making the post-Enforcement weekend a clear statistical outlier. So this isn’t about “abusing charts” — it’s about showing that even when measured against a year-long baseline, the last weekend stands out as historically weak. 📉 To me, that strongly suggests the drop wasn’t random noise from a few collabs or special events, but a structural shift specific to the crackdown period.
📊 After Twitch’s major viewbotting crackdown, real audience numbers shifted fast. Typical hourly drops ranged from 17–21%, but at peak the decline hit -47% compared to the week before. Full breakdown of the ripple effect ➡️ streamscharts.com/news/how-twitc…


As @wellenborg said: 🗣 “One in ten streamers who use broadcast analytics tools engage in viewbotting, attempting to manipulate their stats.”


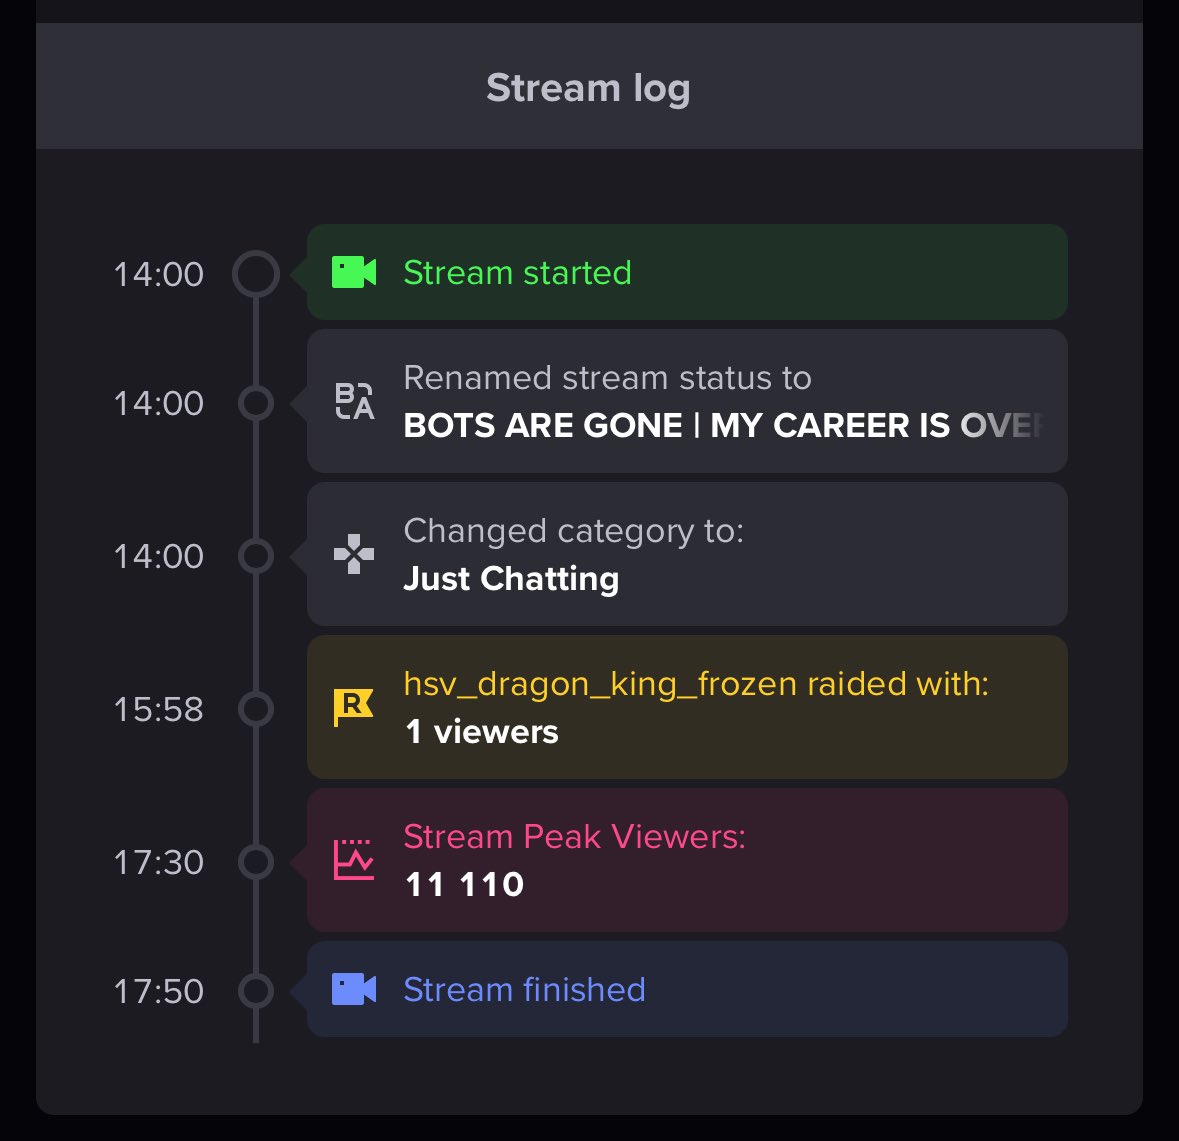
Twitch has cracked down on bots in the 2-3 days and viewbotters/victims of viewbotting have been exposed. Streamers that are part of groups/orgs are seemingly being botted much more heavily. I don’t want to start witch hunts but the data is interesting. Go see for yourself