
Zirillian
51 posts

I will be giving away a FREE copy of my book.
Guess the opening print for $NVDA tomorrow.
*Answer needs to be submitted in comments before market closes. Acceptable format: $222.18
Read about it here: a.co/d/01fMrDda

English

In Plain English
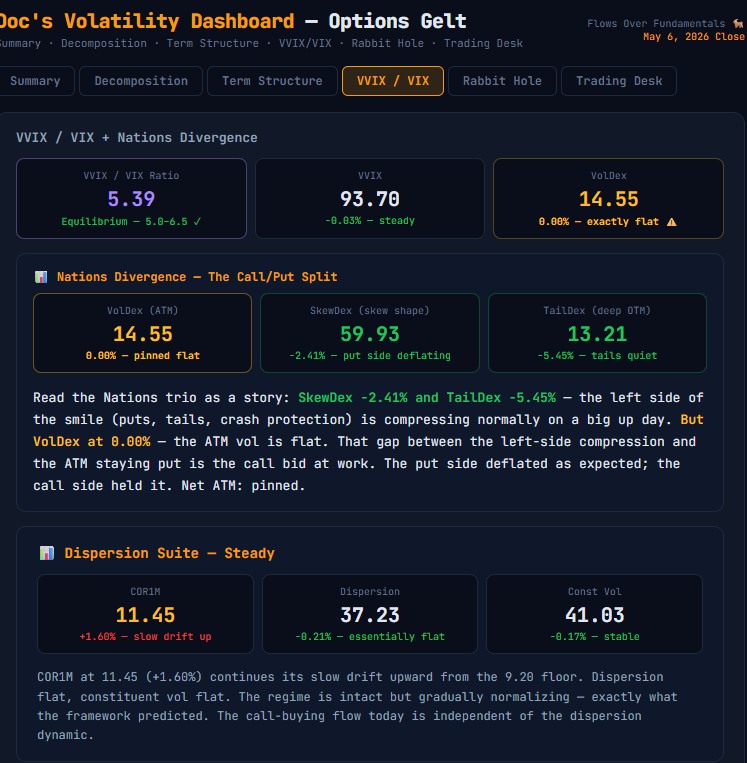
The Nations trio told today's story in three numbers. Put side (SkewDex): −2.41%, compressing normally on a big up day. Tails (TailDex): −5.45%, nobody buying crash insurance on a semis-led rip day. ATM (VolDex): 0.00% — exactly unchanged.
That zero is the signal. In any normal big up day, VolDex would fall too. It didn't — the call buying held the ATM surface exactly in place. The two forces (rally trying to compress ATM vol + call buyers bidding it back up) tied perfectly. You can see it in the CBOE IV curve chart too: the two implied vol curves are nearly identical — almost no net movement in the surface despite +1.46% in the underlying.
When VolDex is flat on a big up day, look at the call bid. That's where the signal lives.
Anything to add or clarify Scott (@ScottNations )?
@Nations_Indexes
@ScottNations
English

Hermes在周末突然犯蠢,今天修了两个多小时,最后发现是compaction的问题😭
Hermes 有自动compaction的机制:历史太长时,会调用 auxiliary.compression.model 生成 summary,然后删
掉一部分旧对话,把 summary 塞回上下文里。
问题是:如果这个 summary 模型配置错了、不可用、或者 provider 调用失败,压缩器会报错,但流程不会
停。它还是会删掉选中的历史 turn,然后插入一个静态 fallback placeholder。
也就是说:还没有生成真正的 summary,历史已经被删了。
更麻烦的是,这个失败只写进 agent.log。如果你是通过 Telegram / Discord / Slack 这些 gateway 在用
Hermes,用户侧完全没有提示。你会以为 compaction 正常完成了,但其实上下文已经被截断,而且没有
summary 可以补回来。
这类问题对 agent 很致命,因为它不是“报错失败”,而是“静默成功”。用户继续聊天的时候,只会感觉 agent
突然断片,但不知道原因。
修法大概是:当 summary generation 失败并 fallback 时,把这个状态显式传出来,让 gateway 用户能看
到 warning。
包括两种路径:
1. 自动触发的 auto-compaction
2. 用户手动调用的 /compress
warning 里会说明这次丢了多少 turn,并提示检查 auxiliary.compression.model 配置。
已提 PR,救救天才:
github.com/NousResearch/h…
@Teknium @NousResearch

中文
Zirillian retweetledi

> trading polymarket like a sportsbook
> picking sides. having opinions. losing money
> someone mentions "oracle latency"
> I google it
> polymarket is on-chain
> every resolution is a blockchain transaction
> event resolves in real world -> oracle hasn't updated -> market still trading at wrong price
> that window is 11 seconds
> I've been betting on outcomes
> the other guys are front-running the settlement
> I was playing the wrong game the whole time
st1ne@SolSt1ne
English
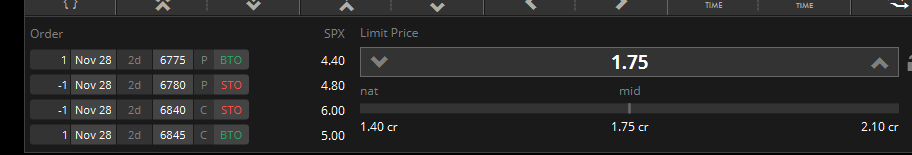
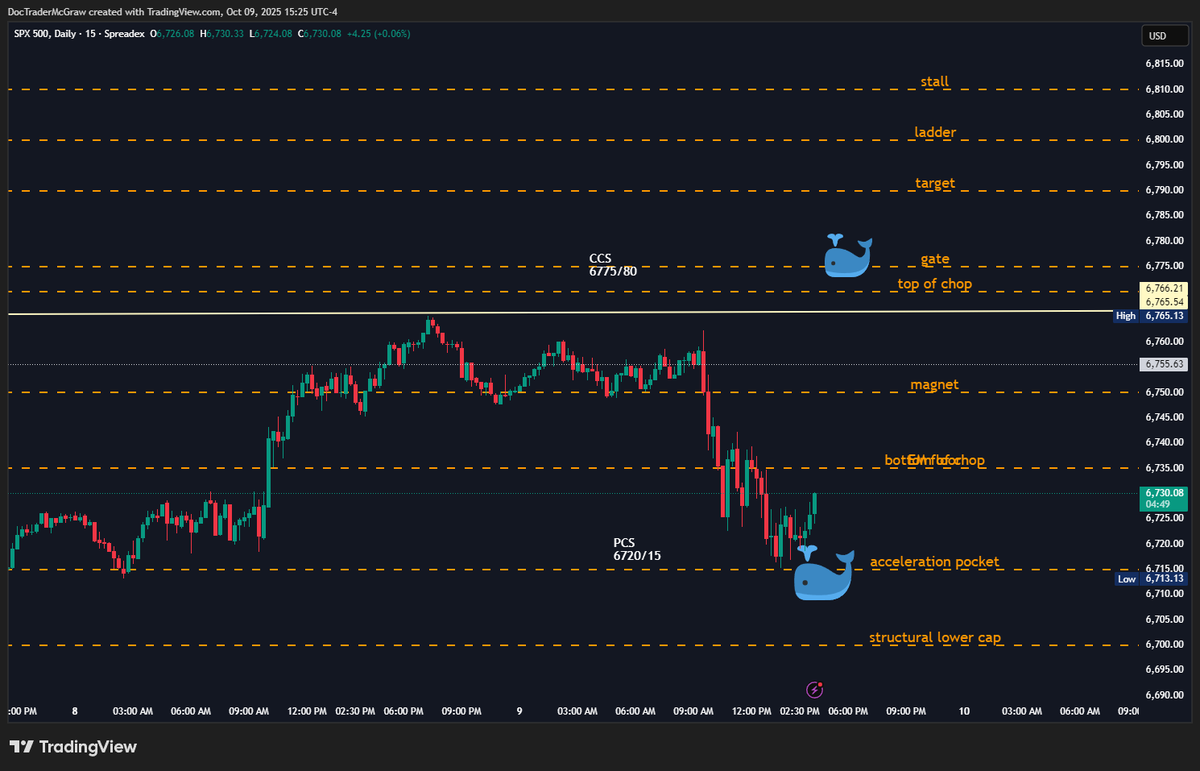
@doc_mcgraw kinda seems like selling CCS in an uptrend is a bit dangerous to do blindly
English
The IC Whale Survivors fund Missed again today (taking refuge in the RUT valley)
Looks like only a fraction survived for the next round or thought better of it
Today's loser was an> 25 delta ish call sold, so for tomorrow they sold a lower delta call but to get the 1/3 the width premium they sold a 28 delta pcs
Good luck gang
@InsideOptions_

English
@TailThatWagsDog It's worth paying for Supergrok ($40/month) to get the best models (4.1 Beta Thinking mode). I also use Grok to help me with options trading and analysis (of the same flavor of stuff you are doing).
English

Category: Evolving Insights
What I'm seeing is that I can reduce errors by providing a very clean data file.
In other words, if I scrub the data and carefully label header columns ... the AI assistant performs much quicker and delivers cleaner results.
This is key:
I've got to give the platform a squeaky clean file ... a "scrubbed" data file, if you will ... label columns carefully ... and ask for the most pertinent analyses given the provided data.
Also ... I'm seeing Grok choke when other platforms do not. (Still comparing, here ... but probably leaving Grok.)
Looks like you need a Pro subscription to get pro results.
But I can see, already, that to fully leverage this AI tool ... you've got to know what you're doing as a trader ... and you've got to present a very clean data file.
"Garbage in - garbage out" totally applies here.
s@FractalVeritas
@TailThatWagsDog I’ve seen it make a lot of mistakes. What’s your assessment?
English

🚨SAYLOR DESTROYS ALL CRITICS WITH USD CASH RESERVE - STRATEGY UPDATE 12.1.25🚨
Michael Saylor just broke the brains of every critic who spent 5 years predicting Strategy’s collapse.
The $1.44B cash reserve announcement completely destroys the “LUNA 2.0” narrative and exposes how unserious the crypto commentariat really is.
Strategy holds 650,000 BTC and enough cash to run the company for nearly two years with ZERO BITCOIN SELLING.
In this video, I walk through the entire update like adults while laughing at the panic influencers who still think “MSTR bad” is a sophisticated thesis.
S&P Global got addressed directly.
Insolvency claims got vaporized.
Market access concerns got resolved in real time.
Critics are now scrambling to pretend they understood any of this.
Watch the breakdown. Watch the receipts. Watch the complete destruction of the “death spiral” storyline.
Strategy is not failing. Strategy is expanding.
THE CRITICS ARE FAILING:
English
@liquidoser this has been pretty interesting to watch live today. Thanks for creating.
English

Minor fix for premarket equity thing that TOS does. Probably only something that happens at the beginning of the week.
drive.google.com/file/d/1mIUnRR…
English
@liquidoser appreciate the fix. Also just noticed the bar graphs off to the right too.
English
youtu.be/s2CgCxF6UOI
Quick preview of how to use Cloutseeker™
I'll probably add more to the file later since some people are interested in having vanna. Current file has 6 days of SPX and 8 weekly slots for single names.
drive.google.com/file/d/1cxyVHw…
YouTube
English
I've been a paid member of the room for 8 months and all the images posted on the X account come exactly from the tools offered to paid members in the room. There might be some from a v2 version of the dashboard to be released this week but all in all, James puts in some serious work to create and maintain the tools for the room. If you didn't see it, you simply weren't present enough or ask questions to understand how to get/use a particular feature.
English

@foundryfutures @dangaidan Can you have one of your members respond to this post then? Ty
English

ES RECAP -
📊 Morning prep nailed the chop inside $ES_F 70% implied range with heavy $SPX OTM call supply acting as a ceiling.
We squeezed right into those OTM calls then down she went! 📉 Hard stall as afternoon charm unwind kicked in exactly as we thought it would per our dashboards Charm exposure map!
#SPX #ES #ES_F #Futures #futurestrading #Options #OptionsTrading


English

If anyone wants access to my SP5T1 indicator on TradingView, post your TV username here then wait 24 hours. The indicator will be available to you once I add your username to the auth list, which I will do periodically after hours.
#published-scripts" target="_blank" rel="nofollow noopener">tradingview.com/u/LewisDePayne…
English
A Former Trading Buddy of mine (‘side by side” on screen share / voice chat every day, all day for months? a Year? Anyway, he went back to school and got a PhD. in AI / Machine learning or whatever. Of course, his dissertation was on what else - 0DTE Spx Options trading and volatility. Something we discussed and lived daily. When it came time to pick a topic we chatted about things - topic, expected findings etc. Anyway, here is my fast take away of his paper. (link to paper embedded at the end)
🌀 What Really Happens With 0DTE — Insights From the Data
There’s a lot of noise around 0DTE options. Every few weeks, someone floats a theory that today's zero-day flows will blow up the market. That they’re destabilizing, reckless, maybe even “greasing the wheels” for another Volmaggedon.
But here’s the thing: the numbers say otherwise.
A recent academic study dug deep into intraday 0DTE trading — real volume data, index volatility, and market maker hedging mechanics — and the result flips the headline fear on its head.
💡 What the Study Found
0DTE trading reduces volatility on average. On days with strong 0DTE participation, S&P 500 realized volatility drops — by 60 to 90 basis points annualized. That’s not noise reduction. That’s structure doing its job.
Market makers are the stabilizers. They aren’t adding chaos. They’re soaking up risk, hedging off gamma exposure through index futures, and flattening intraday swings. Their hedges often run counter to price moves — muting momentum, not fueling it.
It’s not about speculative gambling. It’s a flow engine. 0DTE contracts are often just long-dated positions aging into expiry. As they approach zero days, hedging demand kicks in. Market makers don’t chase volatility — they absorb it, recycle it, and control its shape.
🔧 How the Hedging Mechanism Works
As gamma ramps into expiry, option books get sensitive. Market makers holding short options need to hedge that exposure — fast and often intraday.
When price spikes, they sell. When price drops, they buy. This contrarian hedging response creates pressure that dampens swings — like a self-correcting system.
It’s volatility attenuation in action. Not theory — execution.
🛑 Why the “Crash Catalyst” Argument Doesn’t Hold
Popular claims that 0DTE is setting us up for a disaster don’t line up with the data. Even at record volumes, the flow remains balanced, recycled, and mechanically absorbed by intermediaries.
Market makers aren’t letting gamma stacks run wild — they’re net-neutral most of the time. No evidence suggests systemic fragility from current 0DTE structures.
Sure, tail risk isn’t ruled out — it never is. But that’s not the norm. And this paper doesn’t find anything that would justify regulatory panic or ban-style restrictions.
📍 What Traders Can Take Away
Structure > Hype: Ignore clickbait narratives. Watch positioning, flow, and actual liquidity responses.
Expiration mechanics matter: 0DTE is often just the final day of previously placed trades. Map the lifecycle, not just the timestamp.
Index futures are the hedge book: If you’re trading SPX options intraday, futures activity is your real tell.
Hedging flows are often anti-move: When you see strength fading or dips reversing fast, check your gamma zones and pin levels.
🎯 The Bottom Line
Market makers aren't threatening stability — they’re quietly reinforcing it.
0DTE trading isn’t chaos. It’s calculus. And for traders who know where the hedges live and how they move, it’s a signal-rich landscape.
Not a hazard zone. A roadmap.
papers.ssrn.com/sol3/papers.cf…
English
@RentYourStocks The market trades on vibes now, not facts or rules.
English

I didn’t follow the circuit breaker debacle and I am too exhausted to dig.
Would someone explain what happened in 240 characters or less, if true why didn’t market halt?
English

@tony_mansour @ConvexValue Yup exactly, I started recording my screen and compressed it into a 5 min , entire day recap to be able to visualize how all the mechanical ⚙️ Greeks and volumes move price around next to a live chart 📊. Best platform ever !!!
English

Perfect example of how I learned to use @ConvexValue. Create a tab and recreate this command. Watch it daily and learn.
Also --> better to be an option seller than a buyer for the next few days if you can stomach the pops and drops.
Convex Value@ConvexValue
$SPX IV down across the term structure. Quite a big step down too. Command: terms spx days=15 hb
English
Below is an overview of how some traders look at the VIX:VVIX ratio, along with possible “buy” and “sell” thresholds. Keep in mind there’s no universal standard—these levels vary by strategy, time horizon, and market regime. If you can’t find a specific benchmark in the literature, you can adapt your own thresholds based on backtesting or personal observations.
What Is the VIX:VVIX Ratio?
VIX measures the implied volatility of the S&P 500—often viewed as the market’s “fear gauge.”
VVIX measures the volatility (or implied volatility) of the VIX options themselves—how quickly the VIX might change.
The VIX:VVIX ratio compares near-term implied volatility on the S&P 500 (VIX) to the volatility of that volatility (VVIX).
Why It Matters
When the ratio is high, it means the VIX itself is elevated compared to how rapidly that volatility is expected to move. Some see it as the market signaling immediate concern about index volatility but not a proportional fear of volatility spikes.
When the ratio is low, it means the market is pricing the possibility of big swings in the VIX (high VVIX), relative to the absolute level of VIX, suggesting deeper concern for tail risks or sudden surges in volatility.
Common (or Proposed) Thresholds
Because there’s no single “official” threshold, many traders craft their own reference levels. Here’s a framework that some use—or that you can adapt for your own analyses:
VIX:VVIX Ratio Interpretation Possible Action < 0.15 Very Low – Markets anticipating big swings in volatility (VVIX) relative to VIX Potential “complacency in the index” or “overpricing of tail risk.” Could imply a buy signal if you expect actual volatility to remain moderate. Some traders also interpret it as a red flag for potential storms. 0.15 – 0.25 Neutral Zone – Typical environment in many market regimes No strong signal. Traders often rely on other indicators to confirm bullish/bearish leanings. > 0.25 – 0.28 Elevated – Market sees significant near-term volatility (VIX) but isn’t pricing huge movement in VIX itself Some interpret it as near-term fear about the index but not about volatility exploding. Possible exhaustion if the ratio climbs too high—potential short-vol or equity-buy scenario if confirmed by other signals. > 0.28 – 0.30 Stretched – Ratio is high enough to suggest near-term “fear” is outrunning “vol of vol.” Could imply a contrarian sell volatility or buy equities setup, assuming other data confirms a peak in fear.
Note: These numbers are just one example. Some traders use tighter ranges (e.g., 0.18–0.24), while others shift thresholds to align with backtested signals.
Interpretation in Practice
High Ratio → “Immediate Fear, Not Much Fear of Vol. Spikes”VIX is high, but VVIX isn’t rising at the same pace.
The market is concerned about short-term equity movements but not expecting huge jumps in VIX.
Often occurs around peak nervousness. Contrarians see it as a potential spot to fade volatility or buy equities.
Low Ratio → “Tail Risk or Volatility Spike Concerns”VVIX is high compared to VIX.
The market is hedging for abrupt VIX spikes, tail events, or big volatility swings.
Can precede heavy market turbulence if the fear is validated—or a relief rally if those fears don’t materialize.
Neutral Ratio → “No Strong Signal on Its Own”The ratio drifts in a middling range, providing little directional edge.
Traders layer in other indicators, such as skew measures, gamma exposure, or fundamental analysis, before committing capital.
Creating Your Own Levels
Historical Averages: Pull data on VIX and VVIX, then calculate the ratio’s mean and standard deviations for various lookback periods (e.g., 1 year, 5 years).
Upper/Lower Bands: Use ±1 or ±2 standard deviations from the average ratio to mark potential overbought/oversold extremes.
Event Studies: Investigate how the ratio behaved before and after major market moves (e.g., corrections, rallies, Fed announcements).
Example: If the ratio’s 1-year average is 0.20, with a standard deviation of 0.03, you could define:Overbought: Above 0.26 (two standard deviations).
Oversold: Below 0.14 (two standard deviations).
How Traders Might Trade It
Signal ConfirmationCombine VIX:VVIX ratio with SPX price signals, RSI, or gamma exposure.
Example: IF ratio > 0.28 and SPX hits a major support, THEN consider “dip-buy” if other indicators align.
Options StructuresIf ratio is low, some may buy tail hedges (e.g., long OTM puts) anticipating a volatility spike.
If ratio is high, some might sell short-dated calls or puts, betting on a reversion in VIX or stable volatility.
Mean ReversionIf the ratio historically oscillates within a band, extreme readings may revert quickly.
Traders look for quick intraday or multi-day moves capitalizing on the ratio snapping back to its mean.
Bottom Line
The VIX:VVIX ratio is one tool among many for gauging market sentiment and potential turning points in volatility. While no single ratio guarantees buy or sell outcomes, consistent patterns in extremes can hint at when volatility is overbought or underbought, helping traders anticipate market inflection points. Always cross-check with additional indicators and risk management protocols before acting on any signal.
English
@jam_croissant I finally figured out the -10-12% reasoning. Can't believe it took me that long to do the math.
English