MoonCakeyUSA
254 posts
MoonCakeyUSA
@MoonCakeySTEPN
Sell Side Options Trader and ICT student
เข้าร่วม Mayıs 2014
63 กำลังติดตาม21 ผู้ติดตาม

This gives us pause in raising year end solana:J3NKxxXZcnNiMjKw9hYb2K4LUxgwB6t1FtPtQVsv3KFr targets. We knew 7462 was coming. We predicted it in September and reinforced our prediction in March when the market was tanking. We knew the math. The market has not traded in a regime like this in over 18 months.
$SPY $QQQ
English
@alphaticaio Sounds like a headwind for market direction - can you confirm? Or are we still watching what happens next week during FOMC and OPEX to get a clearer picture. I have been following the bearish and bullish patterns you wrote earlier. Continuing to monitor - thank you
English
@alphaticaio Very fascinating data - we are expecting fireworks into end of the year 🚀🚀🚀
English
$SPY is up +10.93% through May. FinTwit is asking: has it peaked?
We tested 22 years of annual highs, H2 returns, and mid-year momentum. The answer is almost certainly no.
The annual high occurs in December 64% of the time. In H2: 77% of the time. In Q4: 68%. The market doesn't peak at mid-year. It peaks at year-end.
SPY has peaked by June 1 in only 5 out of 22 years (23%). Those five years: 2005, 2008, 2011, 2015, 2022. Every single one was a bear market or a correction year. In a normal year, the peak hasn't happened yet.
Average additional upside after June 1: +13.42%. Median: +12.83%. The market typically has another 13% to go after mid-year.
When SPY is up more than 10% by June (exactly where we are), the data is even stronger. Four analogs: 2013, 2019, 2021, 2024. H2 average return: +13.53%. Win rate: 100%. None of them peaked by June. All four peaked in December. Average H2 max drawdown: just -2.51%. Average full-year return: +27.20%.
Strong H1 minus Weak H1 forward returns: +9.28%. Bootstrap confidence interval excludes zero. This is statistically significant (p = 0.014). Momentum, not mean reversion.
YTD return vs full-year return correlation: r = +0.665 (p = 0.0007) in SPY. r = +0.843 (p < 0.0001) in QQQ. Strong first halves predict strong full years. There is no mean reversion pattern in the data.
"But this is a midterm year." We tested that too. Five midterm years in sample (2006, 2010, 2014, 2018, 2022). Four out of five had the annual peak AFTER June. The only midterm year that peaked before June was 2022, a Fed hiking cycle bear market. Midterm years are consistent with the broader finding. Small sample (n=5), but directionally clear.
The one caveat: 82% of worst annual drawdowns START in H2. The back half of the year is where both the upside and the risk live. When SPY is up >10% by June, the H2 drawdowns have been shallow (-2.51% avg). But H2 is not risk-free. It's where the biggest moves happen in both directions.
The data says the peak is ahead of you, not behind you.
$SPY $QQQ $SPX

English
@alphaticaio Thank you Alphatica for building so much credibility. The amount of research you guys do are so underrated for us retail traders. Fintwit should really be paying attention as you guys have so much value here. Bullish on Alphatica 🫡🚀🚀🚀
English
We posted this research on April 18. "Sell in May and Go Away." Here's what May did:
$SPY: +5.26%
$QQQ: +10.57%
Our research said May averages +0.72% with a 77% positive rate. This May was 7x the average in SPY. QQQ returned +10.57%, the best May on record going back to 2004.
The adage said sell. The data said don't. If you sold on May 1, you missed +5.26% in SPY and +10.57% in QQQ in 29 days.
Five months into "Sell in May" season. The scoreboard is running.
$SPY $QQQ $SPX

Alphatica@alphaticaio
🚨🚨🚨Next week FinTwit will be flooded with "Sell in May and go away" takes. Every year, same adage, same fear. We ran 9 statistical tests on it before the noise starts. 22 years. $SPY and $QQQ. Every May-October period since 2003. May-October was positive 77% of the time in $SPY and 81% in $QQQ. The adage implies summer is negative. It's positive 4 out of 5 years. Binomial test confirms: significantly different from a coin flip (p = 0.017). "The seasonal difference isn't real. In $SPY, the gap between May-Oct and Nov-Apr returns has a p-value of 0.49 which is statistically indistinguishable from a coin flip. In $QQQ, May-Oct actually returns MORE than Nov-Apr. Bootstrap confidence interval includes zero for both indices. There is no seasonal edge." The cost of following the adage: $10,000 invested in Buy & Hold grew to $69,649 in $SPY and $195,026 in $QQQ. The "Sell in May" strategy: $34,333 and $44,603. You lose $35,316 in $SPY, 50.7% of your terminal wealth. In $QQQ, you lose $150,423, 77.1%. The adage costs you more than it saves you. The real problem month is September (-0.60%), not May (+0.72%). July is the strongest summer month (+1.97%, p < 0.01). The adage is named after the wrong month. Summer is actually safer. Probability of a >10% drawdown in 60 days: 16% in summer vs 24% in winter for $SPY. The "dangerous" season has lower drawdown risk at every horizon we tested. The edge has decayed and reversed. From 2021-2026, May-Oct outperformed Nov-Apr by +4.4% in $SPY and +7.8% in $QQQ. The adage doesn't just fail, it's backwards now. We tested the event window. In the 10 days before May 1st, $SPY averages +0.74% with a 73% win rate. The market rallies into May. Nobody is actually selling. Sell in May and go away. To where? The market was positive 77% of the summers you missed. The adage cost you half your portfolio. The seasonal difference has a p-value of 0.49 which is statistically indistinguishable from noise. $SPY $QQQ $SPX
English
@PalmBeachDave8 @QuantData Great results Dave! You're compounding 4% daily. What's your mean entry and exit times like or do you just let expire worthless?
English

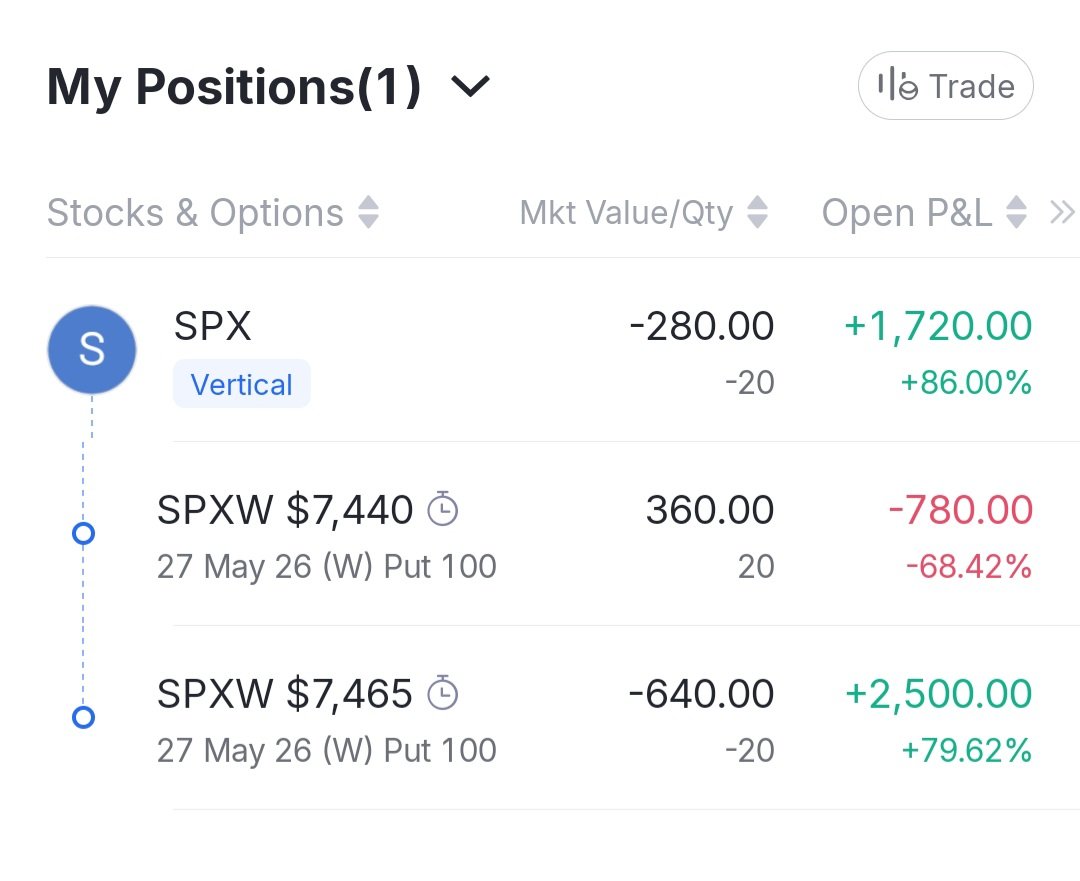
Back to back days of extracting profits from the market with @QuantData . $SPX 0DTEs. Yesterday I went light because data was muddy. Today I waited for the bottom to form and sold credit spreads beneath as usual.
So far everyday in May has been green. Consistency is the name of the game.
@aaplbottomjeans

English
@alphaticaio Thank you 🫡 will mark these levels on my chart
English
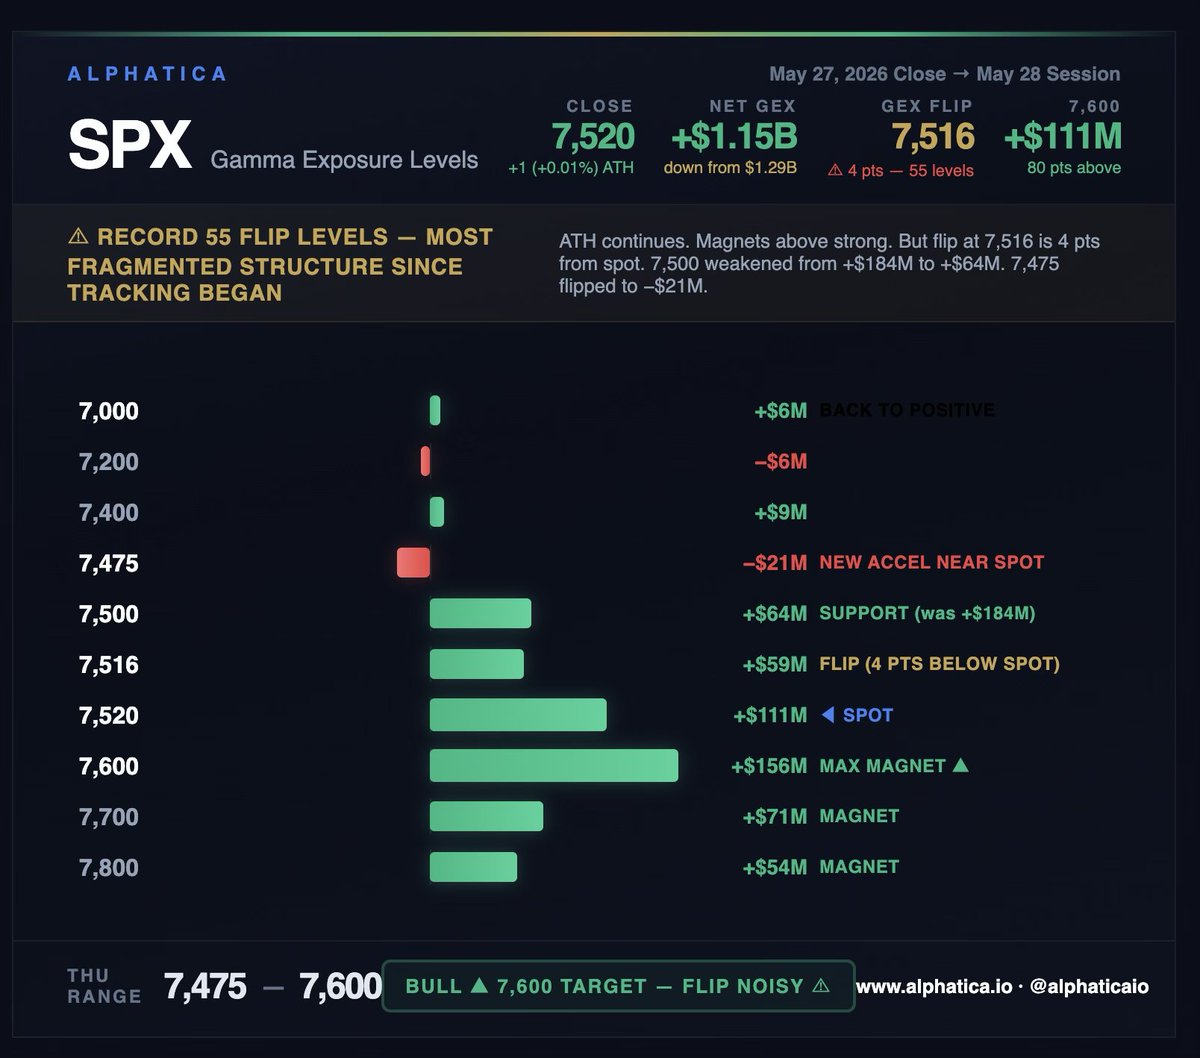
SPX GEX LEVELS: May 28
Another all-time high. The magnets still pull. But the structure underneath is the noisiest it's been since March.
🚨🚨Tomorrow's expected range: 7,475 – 7,600. Grinding toward 7,600 while the flip stays noisy.
SPX closed at 7,520.46, barely green on the day. The grind continues. The 7,600 max magnet at +$156M is 80 points above. The center of gravity sits at 7,680, the most bullish skew of the entire series at 1.9% above spot. Every strike from 7,550 to 7,800 is positive gamma with the magnets laddering cleanly: 7,600 (+$156M), 7,650 (+$79M), 7,700 (+$71M), 7,800 (+$54M). The magnets say grind higher.
The flip says be careful.
The GEX flip cluster has 55 crossing levels, the most fragmented reading since we started tracking. For context, the previous record was 49 levels on May 14 before the OPEX cliff. The fragmentation means the structure near spot is sensitive to small flow changes. The highest flip sits at 7,516, only 4 points below. The fourth knife-edge reading of the series, FOMC at 1 point, May 5 at 13 points, May 18 at 3 points, and now 4 points. But this time with 55 flip levels, not 22 or 29.
The 7,475 strike flipped to -$21M, a new accelerator within 45 points of spot. That's the first negative gamma level near the close since the OPEX cliff recovery. The 7,500 strike weakened from +$184M yesterday to +$64M. That's a 65% decline in the support level in a single session. Put buying at 7,500 (-$68M volume GEX), 7,520 (-$47M), and 7,515 (-$41M) loaded the strikes directly below spot.
Here's the structural picture. Above spot: clean, strong magnets laddering to 7,800. The path to 7,600 runs through dense positive gamma. Below spot: fragmented flip, a new accelerator at 7,475, weakened 7,500 support, and 55 regime crossing points that create noise in both directions.
Net GEX dipped to +$1.15B from $1.29B. Still above a billion. Still functional. But the direction is fading for the third session since the ATH GEX of $1.64B. The gamma rebuilds above spot as the market moves higher but the foundation underneath keeps thinning.
ATM IV compressed to 14.2%, the lowest reading of the series. The market is pricing zero fear at all-time highs with 55 flip levels underneath. When IV is this low, any shock reprices vol aggressively and the gamma structure shifts fast.
Tomorrow is Thursday ahead of Friday's weekly OPEX. The mechanics are familiar: positive gamma pins during the session, then structure lightens after OPEX. The 7,600 target is within reach if the session is constructive. The 7,475 accelerator catches any meaningful dip.
$SPX $SPY
English
@wwwulfy @alphaticaio I can say the same - really appreciate the time consuming mathematical work Alphatica does for Fintwit. Keep up the good work 🫡
English
We encourage debate and welcome skepticism. But if you are going to come on this channel and respond to research that we have been producing at the highest level for years, please come with the data and the facts. That’s all we ask.
"Statistical artifact" is a specific methodological claim. Which artifact? Overlapping observations? We used non-overlapping monthly windows. Look-ahead bias? Entry date is after both reports are in. Survivorship bias? SPY, QQQ, and IWM are index ETFs. If you're going to call something an artifact, name the artifact.
The mechanism is straightforward. When CPI and PPI agree, the inflation trajectory is clear. Clear trajectory means predictable Fed response. Predictable Fed response means lower policy uncertainty. Lower policy uncertainty is priced as lower equity risk premium. Equities rally. This is standard macro finance.
The finding isn't "both hot = bullish." The finding is agreement = bullish. Both Cold produces nearly identical returns to Both Hot (p = 0.81). The market doesn't care about the direction of inflation. It cares about the clarity of the signal. That IS the causal mechanism.
The evidence: 218 matched months, 18 years, three independent ETFs. Agreement vs disagreement difference: p = 0.003 (SPY), p = 0.005 (QQQ), p = 0.038 (IWM). Bootstrap confidence intervals exclude zero for all three. Out-of-sample validation shows the signal strengthening, not decaying. If this is an artifact, it's one that survived every robustness check we ran.
"No robust logical mechanism" isn't a critique. It's an admission that you haven't thought about why it works.
$SPY $QQQ $IWM
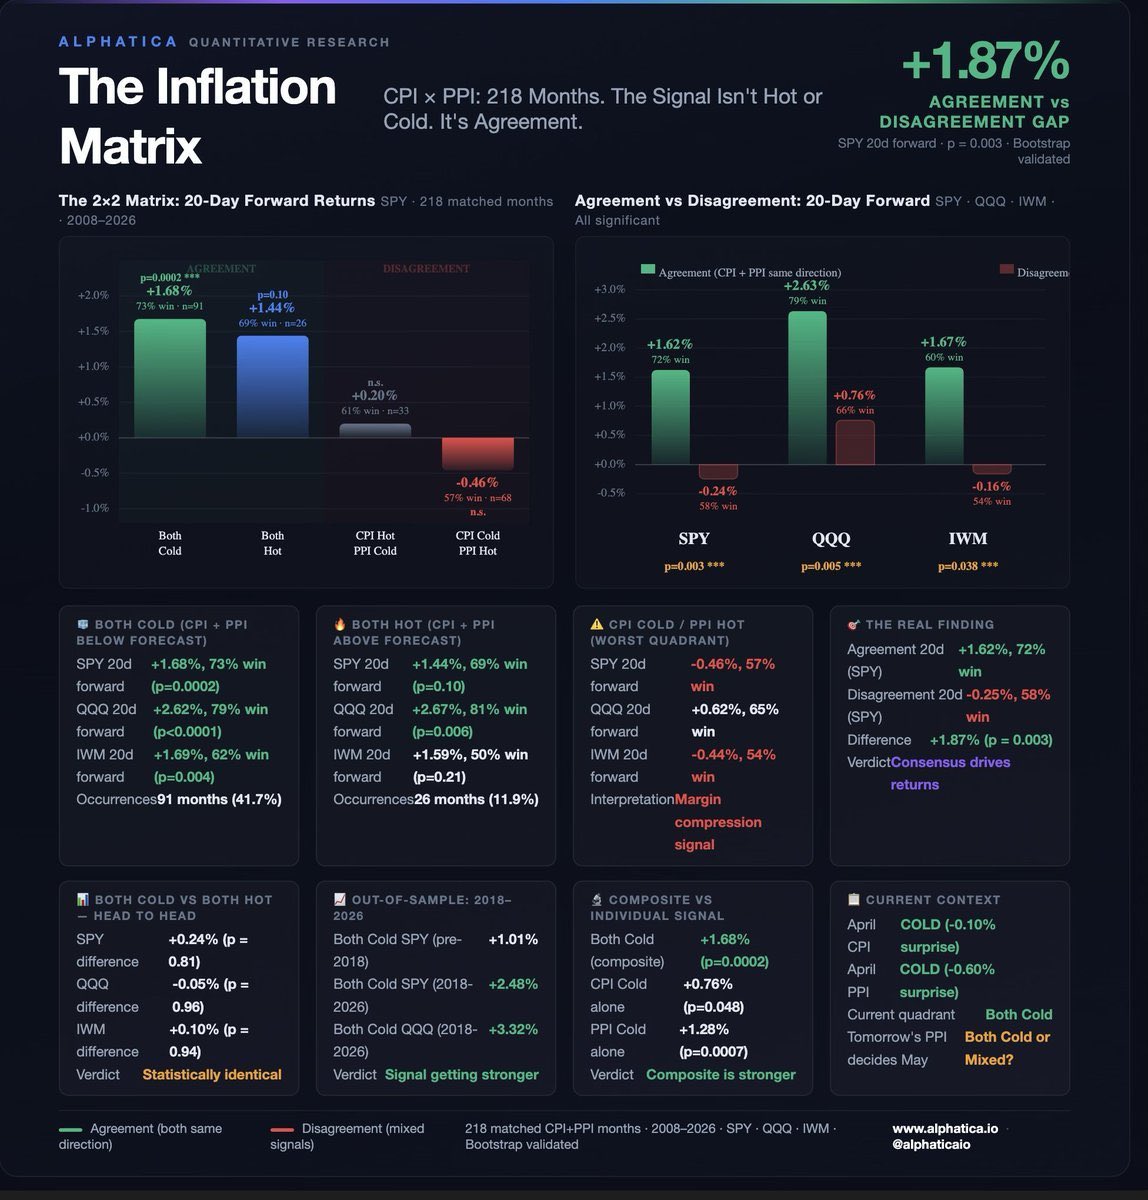
Robert P. Balan@RobertPBalan1
The observed short-term positive correlation between “higher inflation” (specifically the Inflation Matrix’s “both hot” quadrant: CPI + PPI both hotter-than-expected vs. consensus) and equity valuation gains (+1.44% SPY / +2.67% QQQ average 20-day forward) is a statistical artifact. No robust logical mechanism or independent evidential causality supports it.
English
@alphaticaio Alphatica your team works hard - wish there was a discord to live chat 🫡
English
Signal #002: Day 19 of 20
One day left. From -2.51% to +5.14%. Both sides positive.
Cumulative: Longs +1.61% | Shorts +3.53% | L/S +5.14%
$CNC just crossed +50%. The model called it on April 13. 🚨🚨🚨The short book is the backbone of this signal, $PH +10.94%, $CMS +7.57%, $ITW +6.50%, $WEC +3.78%, $AEP +3.17%. 6 of 8 shorts profitable. These names fell while the market steamrolled to double digits. While FinTwit was crying foul about being short anything, our model identified 6 profitable shorts. That's the makeup of a robust stock selection model.
This signal also had two idiosyncratic blowups on the long side ($NCLH -19.7%, $FCX -10.4%) and it still delivered +5.14%. The short book absorbed the damage and then some. That's the L/S mechanism working exactly as designed.
Final scorecard drops Monday.
Signal #003 is on day 8 of 10 for email subscribers.
Short book at +3.78%, one position up +11%, another +10%. Long book has a name up +10.4%. Cumulative L/S at +3.00%. Both sides contributing.
Three signals. Three positive spreads. Email subscribers get everything at entry. Sign up link in bio.
Signal #004 will be sent to our subscribers next week.
Longs: $DOW $NCLH $CNC $FCX $C $CTRA $NEM $CRL Shorts: $NDSN $SPG $MAA $ITW $AEP $WEC $CMS $PH
$SPY $SPX $QQQ

English
@alphaticaio Thank you so much for always creating these publications - very valuable insight. May I request a PYPL ER analysis?
English
SPX GEX LEVELS: May 5
The gamma decay we warned about Saturday is happening in real time.
🚨🚨🚨Tomorrow's expected range: 7,100 – 7,275. Wider than last week's ranges because the gamma is thinner. Below 7,188, the regime flips and the accelerators fire.
Net GEX dropped 27% in three sessions, from +$1.07B to +$787M. Friday's OPEX drained a quarter of the gamma blanket. Today's put buying thinned it further. The structure that pinned SPX in 100-point ranges for three weeks is losing its grip.
The GEX flip tightened to 7,188, 13 points below the close. That's the second time in a week spot has landed on the regime change threshold. Last time was the FOMC knife edge at 7,138 with one point of cushion. The market is walking the same line again, except now the gamma underneath is 27% lighter.
Today's volume tells you where the pressure is coming from. The top 4 negative volume strikes were all below spot: 7,150 (-$51M), 7,100 (-$38M), 7,125 (-$37M), 7,120 (-$30M). That's aggressive put layering within 100 points of spot. The 7,000 strike absorbed -$27M in put buying with 80K puts traded against 19K calls. The zone from 7,000 to 7,175 is being loaded with downside exposure.
Above spot, call buying held at 7,250 (+$42M), 7,240 (+$35M), and 7,300 (+$28M). The magnets are still there 7,300 at +$136M is the max magnet, 100 points above. But the path to get there runs through a minefield of freshly loaded puts that didn't exist last week.
The 7,000 strike is worth noting again. Put OI (1.023M) now exceeds call OI (992K) by 31K contracts. The GEX contribution is +$3M, functionally zero. The anchor of the entire March-April rally has completely neutralized.
Here's where we are structurally. Saturday's alert said the path of least resistance shifted lower. The shooting star was invalidated on today's session but the gamma decay and the flow reversal are both playing out. Net GEX dropped 27%, the flip tightened to 13 points, and put buying loaded the zone below spot. The candle didn't confirm but the structure did. Gamma is still positive. Dealers still buy dips above 7,188. The regime hasn't flipped yet. The question is whether tomorrow's session is the one that pushes through.
The decay schedule continues: another 15% of the blanket expires by Friday. By monthly OPEX on May 15, 72.6% of last Thursday's gamma is gone. Each day the structure gets lighter and the flip level tightens.
Yields aren't helping. The 30-year crossed 5% today and the 10-year hit 4.44%. Rising rates compress equity multiples and that pressure is hitting while the gamma blanket that suppressed every move for a month is 27% thinner.
$SPX $SPY

English
@thetechlao Been following you for a few weeks now Shen - very impressive playbook you created and very clear and concise Twitter posts. The impact you are making on here is undervalued imo. Keep doing what you are doing because it is valuable 💯
English

most traders are stressed about:
what did trump or powell say.
what does the cpi number mean.
where is $SPY going to close today.
i am stressed about none of that.
here’s why.
my hold time is 5 minutes with 0DTE.
$SPY runs $3 in 30 minutes.
$677 → $680.
$680 is a whole dollar psychological level.
first touch.
$3 move to get there.
sellers are exhausted.
i buy a put.
$0.30 bounce down.
$680 to $679.7 in 5 minutes.
option up 15%.
i’m out.
did i know $SPY was going to drop?
not exactly.
but i knew $680 on a first touch after a $3 move almost always pauses.
that pause is worth $0.30.
$0.30 is worth 15–20% on my option.
15–20% in under 5 minutes.
i don’t trade the trend.
i don’t predict direction.
i don’t hold through news.
i trade one reaction.
at one level.
for one small move.
then i wait for the next reaction.
you don’t need to know where the market is going.
you just need to know where it tends to pause.
this type of reaction happens multiple times a day.
and all you need to do is just wait.
that’s it.
that’s my whole edge.
English

To find out the name of any song in a video on Twitter, just tag me (@SongFinderBot) in a reply to it!
If I find the song, I’ll reply back to you with the name, artist and a link to it on YouTube!
I’m also a Discord bot! I can be invited here: discord.com/oauth2/authori…
English

🚨I will send $100 to 3 people that LIKE & comment “DEAL”
I already send $25 to one of my followers today after we didn’t cash the last free play now let’s go for $100 Giveaway💰
If you want a 3x ( Raum+Anton) 🔗⬇️

🍀GOBLIN PICKS💰@PotdPrizepicks
Best under for today⚽️
English


@SirPickle_ I miss Japan so much - my dream is to be able to have the freedom to live there thru trading one day. Would love to meet you in person one day over there as well 🙏
English

@MoonCakeySTEPN Yeah still here haha that’s awesome brother hope u had a great time💚
English
Economic Calendar Outlook👁️
𝗠𝗼𝗻𝗱𝗮𝘆: Caution ⚠️ (Newsless Monday)
𝗧𝘂𝗲𝘀𝗱𝗮𝘆: Trade Day ✅
𝗪𝗲𝗱𝗻𝗲𝘀𝗱𝗮𝘆: Caution ⚠️ (X-Mas Eve)
𝗧𝗵𝘂𝗿𝘀𝗱𝗮𝘆: AVOID ❌ (X-Mas Day)
𝗙𝗿𝗶𝗱𝗮𝘆: Caution ⚠️
Not a week you wanna push it.
Volatility will be considerably drier.
Consider just enjoying Holidays lol

English
@GorillaAlerts May you enjoy your time off with your loved ones Mr Gorilla. See you in 2026 🍌🍌🍌
English