Amila Welihinda

889 posts

Amila Welihinda banner
Amila Welihinda

Amila Welihinda

@amilajack

Building @palette_dev -- Stop guessing why your frontend is slow.

SF เข้าร่วม Ocak 2015
1.4K กำลังติดตาม11K ผู้ติดตาม
ทวีตที่ปักหมุด
Amila Welihinda
Amila Welihinda@amilajack·
"Best technical deep dive I have read in a while!" -- Principle Web Performance Eng @ Microsoft 
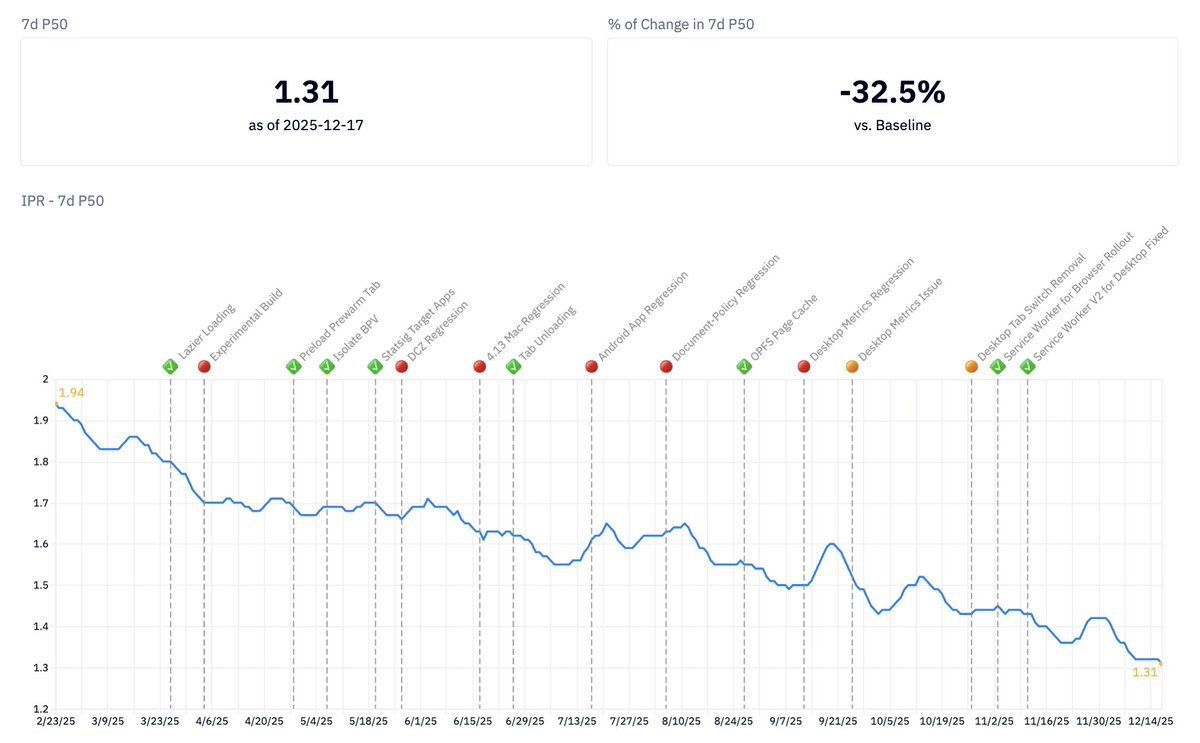
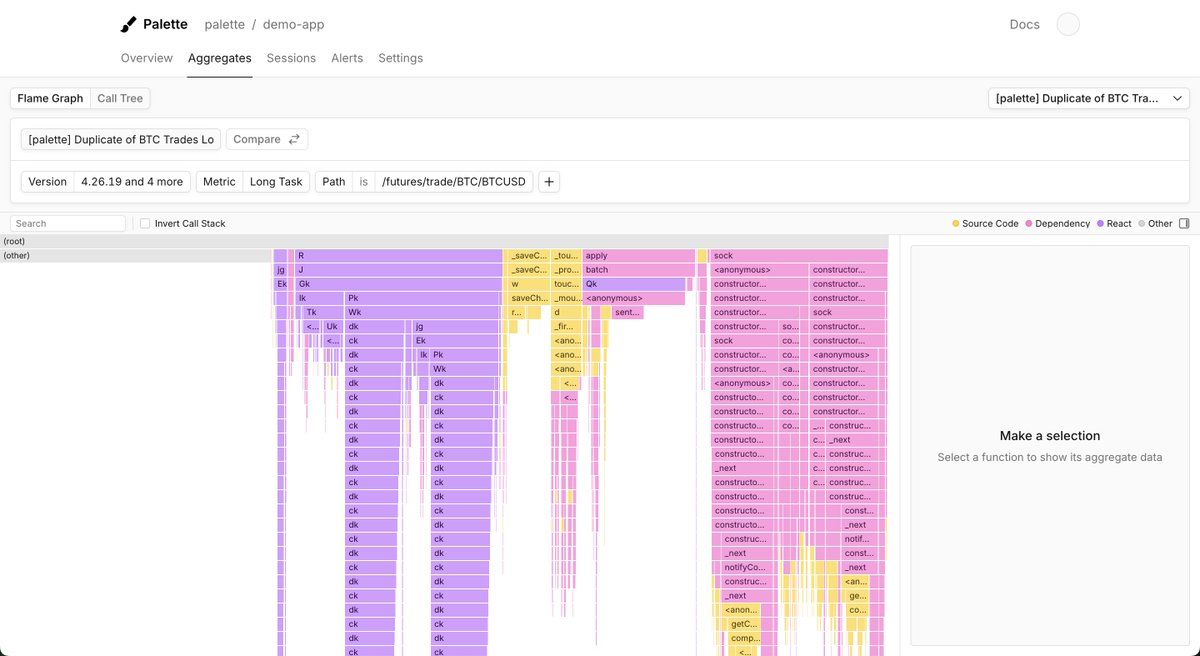
If you're building a large, JS heavy web app, you might find production JS profiling interesting, check it out. palette.dev/blog/improving…
English
2
2
23
3.6K
Amila Welihinda รีทวีตแล้ว
Ivan Zhao
Ivan Zhao@ivanhzhao·
A lot of great ships at @NotionHQ in 2025 that I was proud of. This one was not flashy, not AI, but the most meaningful to me. Pages now load in 1/3 less time (1.9s → 1.3s). It took a lot of patience, craft, and god-forbid regressions to move a big metric like this for all our users. Investing in eng foundations is something we'll continue in 2026, as everything else is built upon it.
Ivan Zhao tweet media
English
31
18
432
45.9K
Magic Patterns
Magic Patterns@magicpatterns·
We've raised a $6M Series A to help product teams go from idea to production. PMs and designers use us every day to design their next feature. Today, we’re also announcing our new brand look and Magic Patterns 2.0
Magic Patterns tweet media
English
12
11
168
26.8K
Amila Welihinda
Amila Welihinda@amilajack·
Browser soft nav is the slowest web experience that's underserved by web vitals. We've been working on a new interaction performance metric at Palette that measures soft nav latency by measuring the delta from interaction to LCP. DM me if you're interested in trying this out!
English
0
0
0
576
Amila Welihinda
Amila Welihinda@amilajack·
Regarding precision, we get the paint latency directly from the browser, which is far more accurate that JS approximation methods for measuring paint latency.
English
0
0
1
346
Amila Welihinda
Amila Welihinda@amilajack·
Identify lines of code blocking React component renders. Here's how you'd see the lines of code blocking click latency for the TabButton component interaction latency for end users. Palette does this by attaching end user JS profiles to React component renders.
English
1
0
1
396
Amila Welihinda
Amila Welihinda@amilajack·
Introducing Palette React Performance Metrics Automatically measure the latency of React components in your app It's like INP for React components
English
1
1
7
631
Amila Welihinda
Amila Welihinda@amilajack·
optimizing palette's distributed profiling is fun on each request we must: 1. load 50MB of source maps 2. ast traversal across source of each source map 3. run sql queries to select and group by across ~40B rows 4. compress and stream resulting 20MB JSON profile payload finish under 10s
English
0
0
2
554
Amila Welihinda
Amila Welihinda@amilajack·
at Palette, traces for every backend request (db queries, IO, api calls) are shown in Chrome Devtools using server-timing headers. would love to see out of the box next.js support for this
Amila Welihinda tweet media
English
0
0
5
628
Amila Welihinda
Amila Welihinda@amilajack·
In just one month at Palette we: 1. built out SSO support 2. rewrote our core profile aggregation service in rust for significant perf wins 3. onboarded 3 amazing enterprise customers Couldn't be more excited for what's next!
English
3
0
11
1.3K
Akila Welihinda
Akila Welihinda@awelm_·
GPT-5 is cracked at frontend. It fully migrated my blog awelm.com from Hugo to @nextjs with a few prompts. It also added these new features:
Akila Welihinda tweet media
English
3
1
13
1K
Sam Lambert
Sam Lambert@samlambert·
people are asking what is unique about the PlanetScale Postgres product. here's one thing:
Sam Lambert tweet media
English
27
9
798
67.2K
Amila Welihinda
Amila Welihinda@amilajack·
what a glow up after 1yr left is our end user JS profiling mvp called "hot functions", sorting functions by total time. right is today -- complete flamegraph supporting zoom/pan/filter
Amila Welihinda tweet mediaAmila Welihinda tweet media
English
1
0
6
766
Amila Welihinda
Amila Welihinda@amilajack·
Atlassian redirecting your browser 10 times before seeing a product is one of the worst experiences of enterprise apps
English
0
0
2
714
Amila Welihinda
Amila Welihinda@amilajack·
we want to make the web apps you use every day faster. to do that, we decided lower the barrier to production JS profiling so any web dev could have Facebook-level perf observability x.com/patmeenan/stat…
Patrick Meenan@patmeenan

Interesting to see the services to make self-profiling easier become available beyond what the big companies have implemented in-house. Some of these browser capabilities have years before you start seeing adoption/ROI but deliver huge impact when it happens.

English
1
0
1
736
Amila Welihinda รีทวีตแล้ว
Patrick Meenan
Patrick Meenan@patmeenan·
Interesting to see the services to make self-profiling easier become available beyond what the big companies have implemented in-house. Some of these browser capabilities have years before you start seeing adoption/ROI but deliver huge impact when it happens.
Amila Welihinda@amilajack

I wrote why Chrome Devtools isn't enough for fixing performance issues at scale. Chrome DevTools is our bread and butter but reproducing end user perf issues at scale using it is difficult and unreliable. Here're what Facebook and Slack are doing: palette.dev/blog/chrome-de…

English
0
1
8
2.2K