English
WhalesSecret.com
191 posts

@whalessecretAPI
ScriptApiLib provides unified API to different digital assets platforms. Devs @WhalesSecret


Antivaxers are the biggest threat to humanity, hands down. More than nukes, volcanos and asteroids combined... Nothing else will matter when viruses overwhelm our health care apparatus and push us back to Neolithic times. All because these jackasses won't take a vaccine...
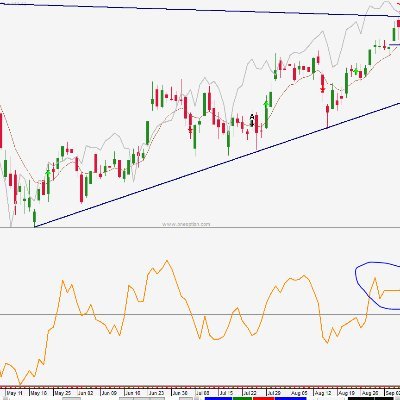

🚨 Bitcoin - The Last Push Before The Crash 🚨 Time to do my long term updated $BTC TA! We have absolutely nailed every major move since 2023, verified by Grok himself! All my record is in public without deleting a thing. Wave 5 is complete and ABC correction is playing out. 126k NAILED ✅ 🎯 We called the top and were YEARS ahead, and now everyone on CT gurus suddenly writes “I told you top was,” meanwhile deleting their post, while we HAVE updated our Elliott Wave or macro every month and everything is on record. If you’re a long time follower of mine you know this! Anyway, what now? Did we reach the top, the final blow-off top? The probability is quite high even though I don’t run with guarantees. The probability is high but let’s dive into the charts. If you value my free work, bookmark, repost, like, and comment to keep this channel alive. Free alpha. No guarantees. Pure probabilities. Read my post “BTC Macro Structure: The 3 Weekly Levels That Decide Bear Market or Not” x.com/DailyCryptoTra… Elliott Wave Theory Structure did what we expected: • Extended impulsive Wave 1 • Wave 3 tagged into the July ATH • Corrective Wave 4 unfolded in a clean ABC • Final sub wave of Wave 5 completed • Last time I wrote “Now forming an ABC correction on the weekly and daily. Seems like we might’ve found our A wave at 99k, but that’s not confirmed until the weekly close. Typically we’ll move up toward Wave B around 109k, 112k, and 116k.” This got invalidated since we did not bottom out and had a weekly close above 99k. However it seems we found our local bottom at 80k which means this is our Wave A. This means we will move up towards weekly Wave B with a price target of 109k. If we pierce through, 112k is possible. Fib level 1.618 is on 109k. • On daily we’ve found our Wave C and now moving towards a sub wave 5 which aligns with our weekly EW (Wave B). • From my June map, 109k had to flip to support, and it did. New ATH printed, followed by a 22% correction. Targets • Primary 120–130k (1.618) REACHED 🎯 • New targets (if weekly confirms) 109k, and if pierced through, 112k Technical Indicators Weekly • Volume: volume up while price down is typically bullish. However, comparing April to now, volume down while price up is bearish. Short term we could see upside, but long term we’re nearing a squeeze. • RSI: below 50, weak for bulls. But at 39 we could retest 50. • Stoch: oversold, could move to the upside. • MACD: still above zero, but downside momentum is strong. Daily • RSI: below 50 but moving up. If it breaks through, that’s bullish. • Stoch: bullish cross moving up. • MACD: crossing below 0 is bearish, showing we’re in a downtrend but could make local highs. • Volume: volume down while price is up is a bearish signal. Charting shows some bullish signs with a good probability of hitting EW targets. Invalidation comes if we break 116k, that would mean the downtrend is broken. Liquidity and Heatmaps Our liquidity heatmap shows strong liquidity at both lower and higher ranges, indicating a quick sweep to upper levels before a larger correction. This aligns with our TA that we’ll likely get a push before the big drop. You can use our liquidity and liquidation heatmap on my site (link in profile or comments). Conclusion If you’re an old G and follower I sound like a broken record, but my conclusion is and will still be the same since 2023, and this is more for the new people reading this. If you’ve been following my long term TA, it’s still playing out beautifully. Here’s a quote from last time: “We are getting ready for the last rally and a top in Q4 before year end. With stagflation and a slowing economy, the jobless data shows clear weakness. We are still in a great melt up, but it’s only a matter of time. Markets tend to crash 3–6 months before a recession becomes official. BTC follows traditional markets. Remember COVID: BTC fell 68% on lockdown fear without a formal recession. This is still the Wave 5 I mapped out in 2023. We got the ATH, held key support, and now line up for the last push. 120–130k stays the base case, 135–145k the extension, 170k is the euphoria outlier, only valid if sustained. After the move completes, remember what I’ve said since day one: Bitcoin corrects 70–90% in cycles. Not a new paradigm. Not ‘this time is different.’ Protect your capital. No one else will.” We saw a sharp drop due to a deleveraging event. Many were too bullish and lacked proper risk management. When markets get over-leveraged and overconfident, they get punished. We usually see these deleverage events before a small rally, a dead cat bounce. If everything follows the plan, we could reach targets 109k which aligns with our daily and weekly EW (weekly Wave B target) and could pierce through and touch 112k, tricking retail to believe we’re moving up again before the real drop. So there is high probability we topped out at 126k Now the important part: The FED will likely start QE. Typically, not always, assets go up to hedge against inflation and de-dollarization. But in 2009 when QE started, markets crashed during the recession. That scenario can happen again, so stay open minded and probabilistic. Don’t count on guarantees, that’s how people get liquidated. Manage your risk like a professional. We’re not here to look smart, we’re here to get paid.