capTEN

1.8K posts

capTEN banner
capTEN

capTEN

@CapitalTen

Contrarian Investor since 30 years, that shares understanding of sentiment, cycles, macro, elliott wave, onchain and market breadth in financial markets.

Nothing is Financial Advice Katılım Temmuz 2021
842 Takip Edilen369 Takipçiler
capTEN retweetledi
Rawl
Rawl@EtherRawl·
The market has been constructive lately as it is trying to price in a Fed pivot while determining what type of liquidity environment comes next based on both macroeconomic and geopolitical developments. As of right now inflation has entered its next phase to the downside, which is something I have been saying for quite some time, because I don't believe inflation is here to persist, and therefore I don't expect it to push the economy into a recession this year. Instead, I believe we are seeing a controlled slowdown that is buying time until more positive economic data emerges. At the same time investors have shifted their expectations from a rate hike in July to a pause, with markets increasingly pricing in rate cuts by September. This is typically a signal of a late cycle environment before the next major crisis eventually arrives, around Q1 2027 IMO. Now, from a technical perspective the stock market is breaking out of this diamond pattern retesting the breakout, so this can translate to an explosive move higher pushing beyond 8,000 and even toward 8,800, or this breakout turns into a deviation/fakeout over the coming weeks, leading to a sharp correction. At the moment, however I don't think that's the most likely outcome based on how I see the macro environment unfolding. As for Bitcoin just as I have said previously, Bitcoin and the broader crypto market are much more sensitive to uncertainty, and that is why they have remained relatively subdued while waiting for a clear directional catalyst. The latest inflation data can be the first important step in that direction, and now we need yields to confirm the move so liquidity can shift back toward risk. If that happens we will see higher prices not only in equities but also in crypto by the time we approach the midterm elections, due to the current administration has an incentive to keep the markets elevated into the midterms, only for conditions to deteriorate 3/6 months afterward, similar to early 2025.
Rawl tweet mediaRawl tweet mediaRawl tweet mediaRawl tweet media
Rawl@EtherRawl

Everything has been playing out nicely, except for the fact that yields are still at key levels, which means they are still bullish. Therefore, the market can't reprice rate cuts, which is the trigger needed right now for risk-on assets to outperform. On the US10Y, we're looking at 4.4%, and on the US03Y, at 4%. If these levels are confirmed broken, then speculative excess can begin, due to the fact that investors will consider it a late-cycle environment, so in order to make even more gains, they will rotate into speculation. For the stock market, I'm still unhappy that we did not fully reach the 7050/7200 area, which means there's still a chance we revisit it. But first, this diamond pattern can break in both directions, so I'm not in a hurry to call a direction. As for Bitcoin, well, Bitcoin is just doing its own thing and has become very uncorrelated to the rest of the market, so I wouldn't be surprised if Bitcoin and crypto hold up way better than the stock market. In the short term, I still think we see higher this month, filling that gap completely or partially.

English
5
4
34
2.5K
capTEN retweetledi
Jason Goepfert
Jason Goepfert@jasongoepfert·
Inflation just saw its largest month-over-month drop in 5 years. Stocks tend to like that, esp over the next 3-6 months.
Jason Goepfert tweet media
English
13
28
224
34.8K
capTEN retweetledi
David Cox, CMT, CFA
David Cox, CMT, CFA@DavidCoxRJ·
what is the trend? $TSX $SPX $QQQ
David Cox, CMT, CFA tweet media
English
1
1
17
2K
capTEN retweetledi
Dagger
Dagger@daggercapital·
Legolas, what do your Elf eyes see?
Dagger tweet media
English
1
7
72
8.8K
capTEN retweetledi
Bitcoin Munger
Bitcoin Munger@bitcoinmunger·
Not much time left in this Bitcoin bear market. Take advantage while there's still time.
Bitcoin Munger tweet media
English
12
25
344
19.7K
capTEN retweetledi
XForceGlobal
XForceGlobal@XForceGlobal·
I'm selling EVERYTHING, again... when this turns green.
XForceGlobal tweet media
English
6
7
153
11.9K
capTEN retweetledi
Brian G ☀️
Brian G ☀️@alphacharts·
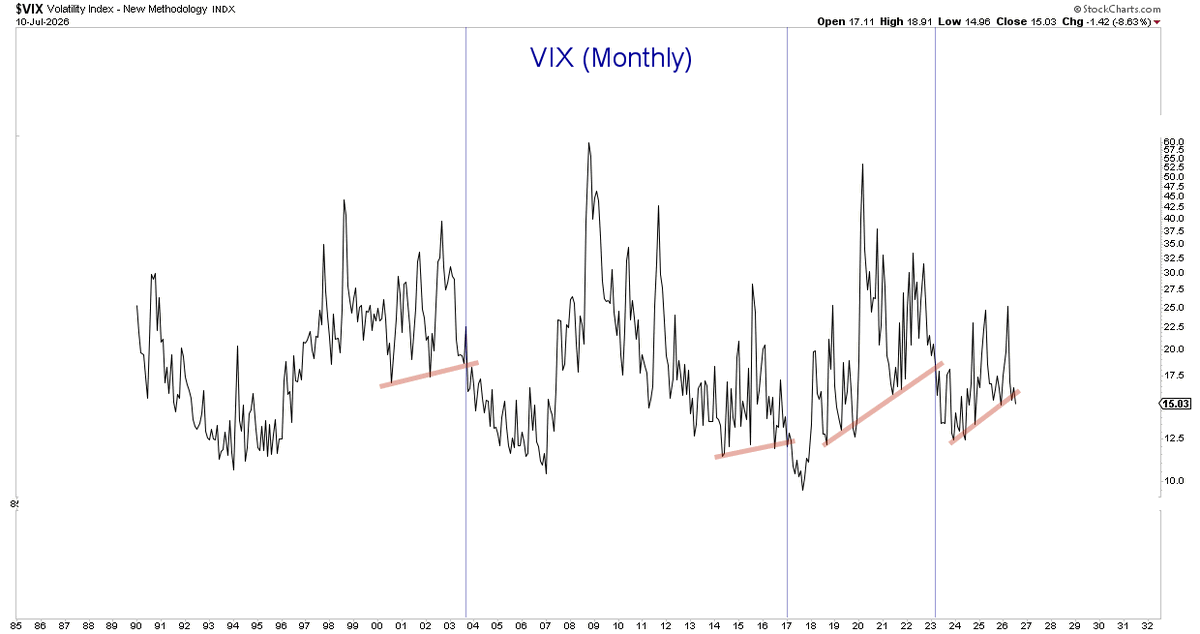
Multi-year breakdown occurring in the $VIX. Past occurrences were very bullish for $SPX: 2003, 2011, 2013, 2017, 2023.
Brian G ☀️ tweet media
English
1
8
49
8.1K
capTEN retweetledi
CRYPFLOW
CRYPFLOW@_Crypflow_·
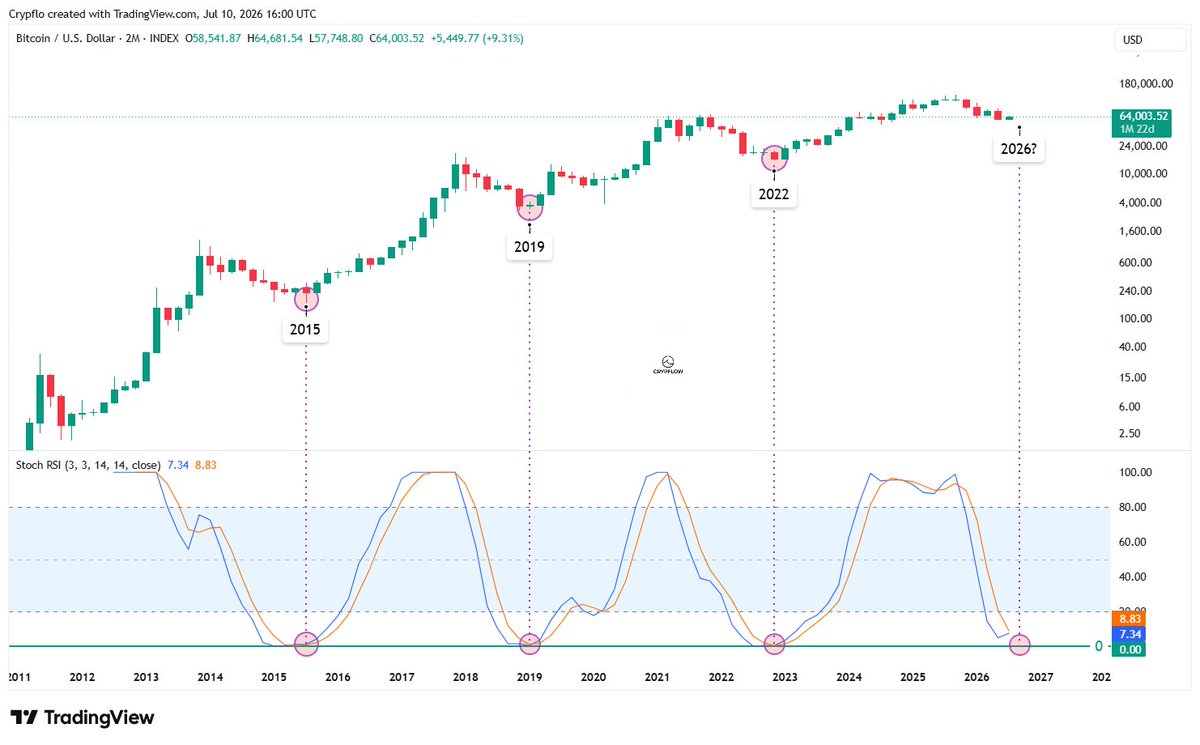
$BTC (2M) – A major bottom signal is close Every previous BTC bear market ended the same way on the 2M Stochastic RSI: It dropped to 0 and printed a bullish cross That cross didn’t mark just a local bounce. It marked the start of a new bull market. It happened in 2015. It happened in 2019. And it happened again at the 2022 bottom. Now we’re getting close to that zone again. Time to pay attention.
CRYPFLOW tweet media
English
11
31
159
7.3K
capTEN
capTEN@CapitalTen·
@ASX__Trader There is clearly a pattern visible in your chart: Only every second correction is an actual bear market after a more sideways movement 18 years before. So we could a see a sideways move again instead of a genuine bear market.
English
2
0
3
401
David Bird (ASX Trader) B.Ed, CFTe
The S&P 500 has never delivered above average returns after these 18 year cycle peaks over the last 100 years. History doesn't repeat perfectly, but it often rhymes. Go back to 1900s, then every 18 years after that, and a remarkable pattern emerges. • 1918: Around a 30% decline. • 1936: More than a 55% crash. • 1954: Five years of dead money. • 1972: Nearly a 50% crash. • 1990: Around 20% total return over the following five to seven years. Positive, but still below the long term average. • 2008: More than a 50% crash. Not once over the last century has this point in the cycle delivered above average long term returns. Now ask yourself... Do you really think it's a coincidence that the Gold-to-Dow ratio is sitting on major support seen only a handful of times in history? Do you think it's a coincidence that the Buffett Indicator is at the highest level ever recorded, the Shiller P/E is approaching dot-com extremes, and almost every major valuation metric is flashing red? Or do you think this time is different because of AI? Investors said the same thing during the dot-com boom. They said it when automobiles transformed the economy. They said it when radio arrived. They said it again when television changed the world. Every generation believes a new technology has rewritten the rules. It never does. Technology changes. Human psychology doesn't. Markets move in cycles. Valuations matter. The COVID decline wasn't a true secular bear market. It lasted only weeks before unprecedented stimulus pushed markets to new highs. The 2022 decline was painful, but it wasn't the kind of prolonged wealth destruction seen in 1929, 1973 or 2008. Most investors today have never lived through a genuine secular bear market. When one eventually arrives, it has a way of humbling people very quickly. History never guarantees the future. But ignoring over 100 years of evidence because "this time is different" has rarely ended well.
David Bird (ASX Trader) B.Ed, CFTe tweet media
English
22
28
203
18.8K
capTEN retweetledi
Aksel Kibar, CMT
Aksel Kibar, CMT@TechCharts·
#SPX Doesn't look like a top reversal at this point.
Aksel Kibar, CMT tweet media
English
30
50
629
122K
capTEN retweetledi
Frank Cappelleri
Frank Cappelleri@FrankCappelleri·
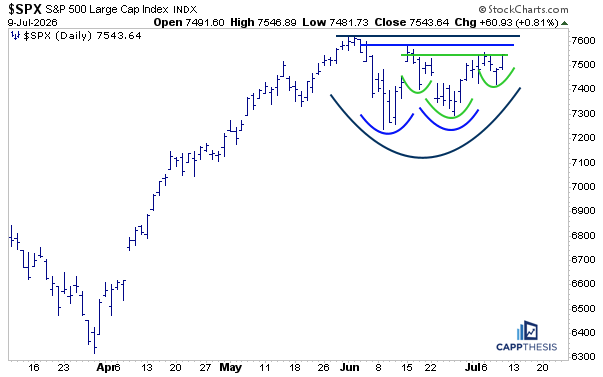
$SPX The biggest challenge right now: keeping track of all the bullish patterns.
Frank Cappelleri tweet media
English
13
23
208
16.9K
capTEN retweetledi
Jurrien Timmer
Jurrien Timmer@TimmerFidelity·
Earnings estimates are still moving higher, and with second quarter earnings season about to start it will be interesting to see what companies are saying about their AI buildout. At some point earnings will decelerate and that’s when the market will get tested in terms of how crowded the AI space is.
Jurrien Timmer tweet media
English
9
22
162
17.3K
capTEN retweetledi
Global Markets Investor
Global Markets Investor@GlobalMktObserv·
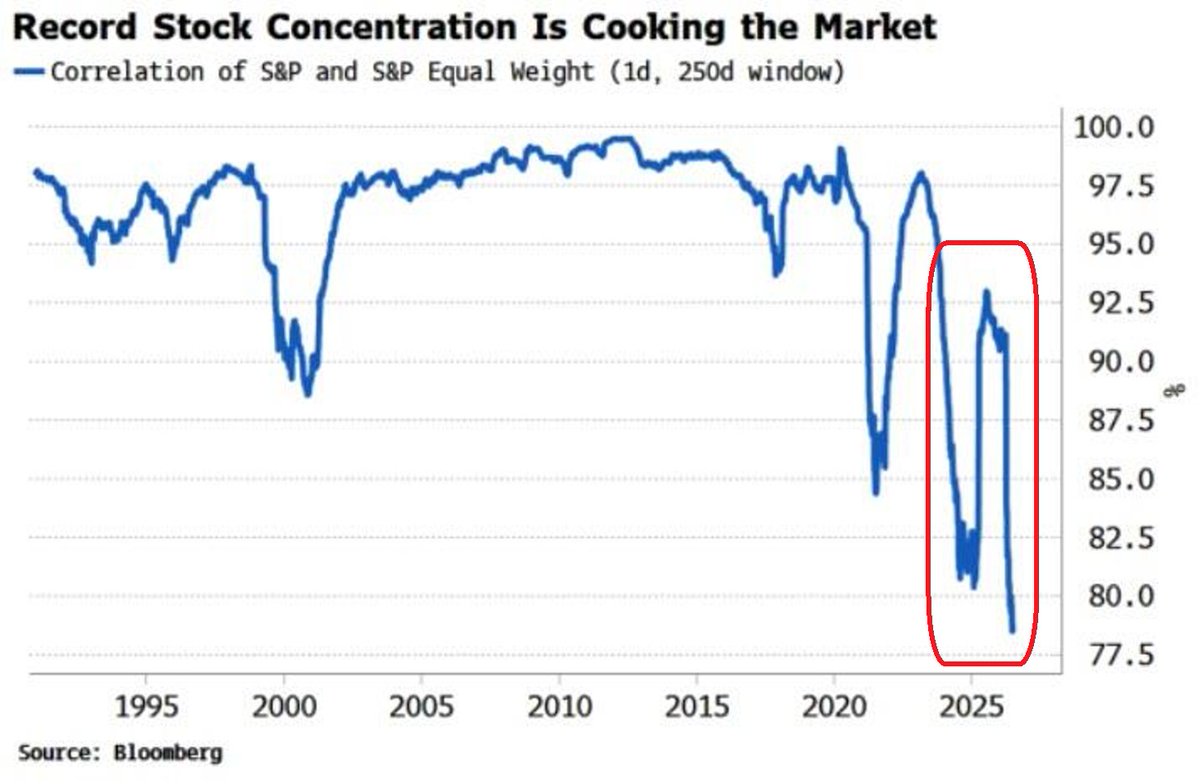
🚨THIS HAS NEVER HAPPENED THIS CENTURY: The correlation between the S&P 500 equal-weighted index and the S&P 500 itself has dropped to ~78%, its lowest level on record. This is happening because a small group of mega-cap stocks continue to dominate the index. The 10 largest companies account for 43% of the S&P 500's capitalization, while the smallest 250 companies contribute just 8%, causing the rest of the market to move much more independently. This concentration is hiding rising risks underneath the surface. The gap between individual stock volatility and overall index volatility, known as dispersion, is at record highs even as the VIX remains unusually low. Low correlation has also encouraged strategies that rely on calm markets, including option selling, risk parity, and systematic dip-buying. That calm could disappear quickly if correlations rise again, which usually happens when a major macro shock hits companies across the market at the same time. Markets this concentrated and this complacent rarely stay stable for long.
Global Markets Investor tweet media
English
28
71
262
23.9K
capTEN retweetledi
Titan
Titan@Washigorira·
#Bitcoin (3W) The longer the consolidation lasts, the stronger the case for a bottom forming.
Titan tweet media
English
22
73
374
24.3K
capTEN retweetledi
Unchained
Unchained@unchained·
The percentage of circulating bitcoin that has been held for 6 months or more has nearly reached all time highs. This often precedes strong moves to the upside. A supply squeeze may be imminent.
Unchained tweet media
English
4
4
80
11.7K
capTEN retweetledi
Ryan Detrick, CMT
Ryan Detrick, CMT@RyanDetrick·
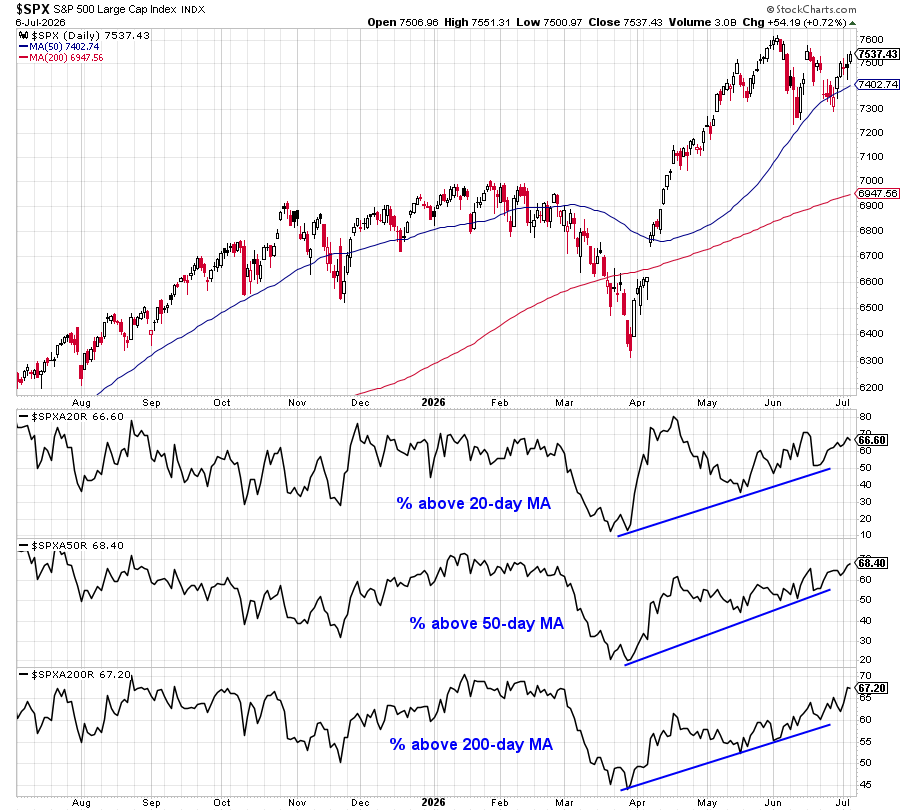
Market breadth continues to improve, with more and most stocks above their 20-, 50-, and 200-day MAs.
Ryan Detrick, CMT tweet media
English
10
36
334
25.7K
capTEN retweetledi
AskLivermore
AskLivermore@asklivermore·
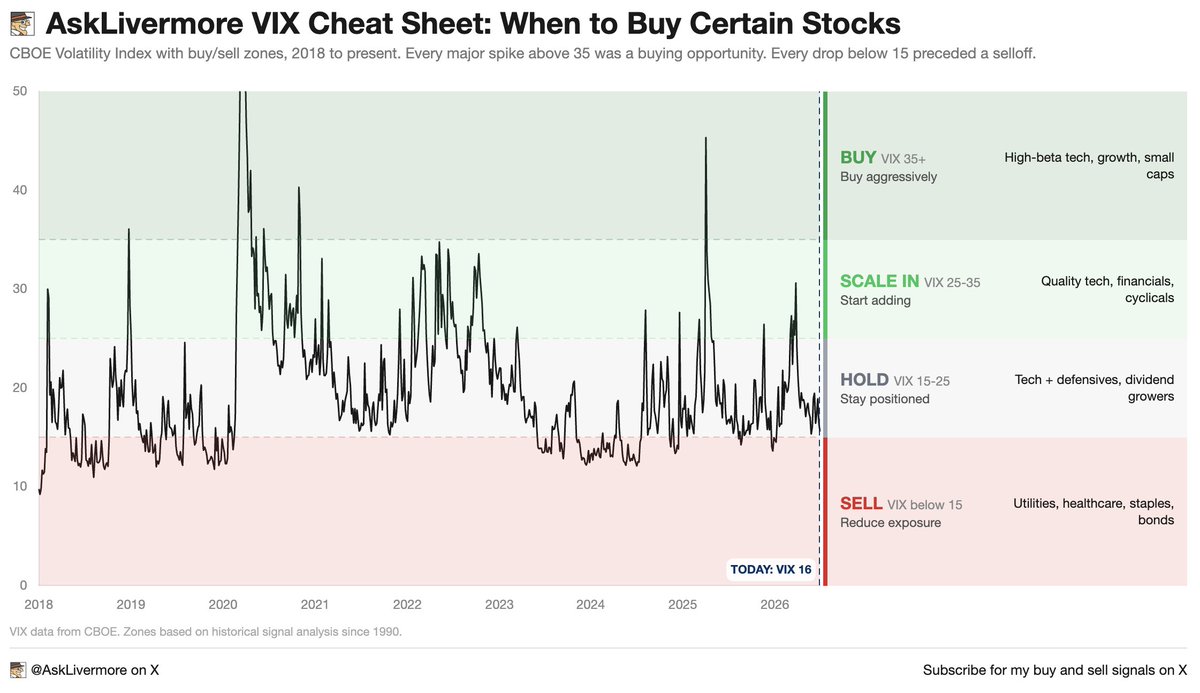
This is all you need to do to make millions in the stock market. Save this. Screenshot it. You will need it. 1. VIX above 35: buy aggressively - High-beta tech, growth, small caps - Every single time the VIX spiked above 35 since 2018 was a generational buying opportunity. COVID bottom. Oct 2022 bottom. Tariff crash. If you bought when everyone else was panicking, you made a fortune. 2. VIX 25 to 35: start scaling in - Quality tech, financials, industrials, cyclicals - This is where smart money starts building positions. Not all at once. Gradually. The fear is real but the opportunity is bigger. 3. VIX 15 to 25: hold - Balanced: tech + defensives, dividend growers - This is normal. Stay positioned. Don't chase, don't panic. Let your winners run. 4. VIX below 15: reduce exposure - Rotate to: utilities, healthcare, staples, bonds - This is when everyone is comfortable. Nobody is hedging. Nobody is worried. That's exactly when you should be. - Every major crash in market history was preceded by the VIX sitting below 15 for weeks. Right now the VIX is at 16. We're in the hold zone. Stay positioned but stay alert. Bookmark this. The next time the VIX spikes above 35, don't freeze. Buy.
AskLivermore tweet media
English
173
890
7.2K
529.4K
capTEN
capTEN@CapitalTen·
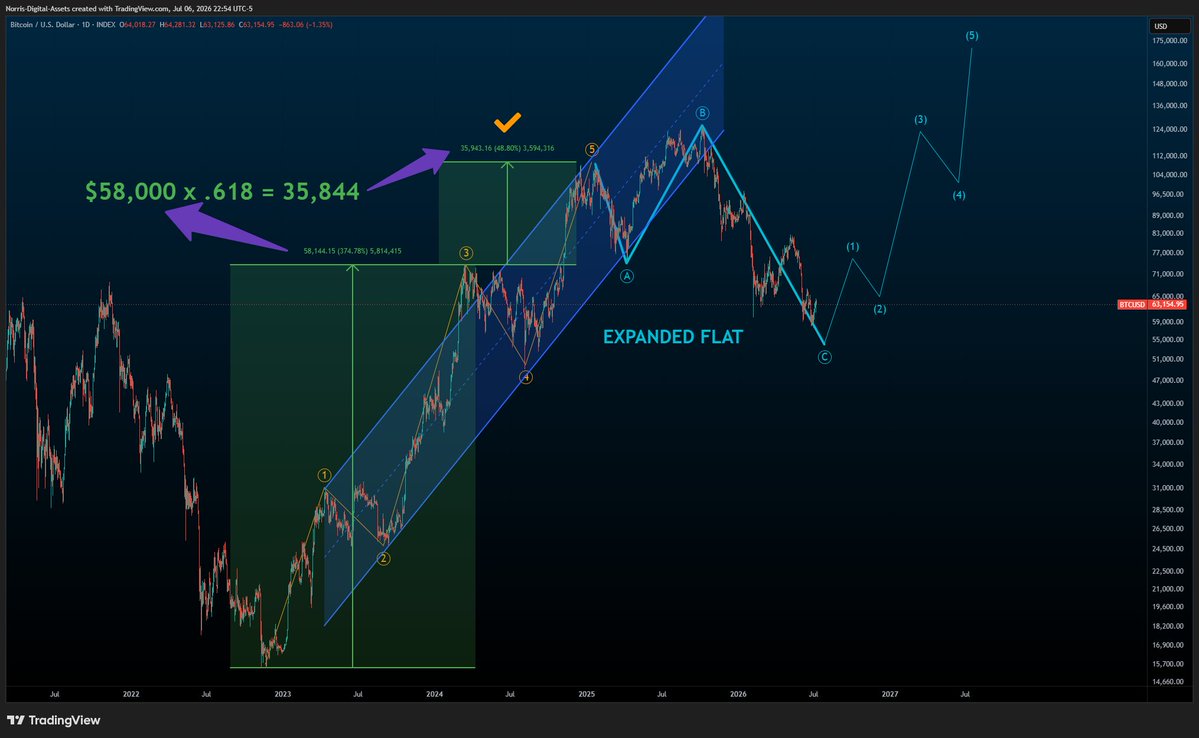
Verified this against London fix data and it goes deeper than the chart match. The Prechter chart (Fig. 6-11, Elliott Wave Principle, 1978) checks out: orthodox wave 5 top Apr 3, 1974 at $179.50 vs. Fib target $180.60. Expanded flat: B $197.50, C $103 (−47%). But the real story is the policy script, and it lands on the exact same wave positions: At the B-top (Dec 31, 1974): gold ownership legalized for Americans + COMEX futures launch. Peak legitimacy, peak euphoria. Buyers got sent −47%. BTC's B-top ($126k): ETFs, Strategic Reserve, GENIUS Act. At the C-low (1976): Jamaica Accords demonetize gold, IMF announces gold sales. Max bearish news. BTC now: CLARITY Act stuck in the Senate, price −54%, sentiment dead. Then 1976–79: IMF and Treasury dump physical gold into the market and price still does 8.25x in 1,245 days. BTC's supply side is tighter: ETFs ~1.3M BTC, treasuries 750k+, 64% of supply dormant 1y+. Nobody left to dump. If Nov 2022 → Jan 2025 was a wave 1 (as gold's template implies), the mapping gives: W3: $210–300k by ~Q4 2028 (1.618–2.618 ext) W5: $450–550k by ~Q4 2029 (C-low + 1,245 days; 8.25x from $57.8k = $477k, converges with Fib) Caveat gold demands you respect: 2.4x of the 8.25x came in the first two years. The rest came in the final 15 months, half of it in the last 10 weeks, and it needed an exogenous macro shock. The boring part comes first. One honest divergence: the impulses match in time (823 vs 757 days) but the corrections don't. Gold ground down 875 days from its wave 5 top, BTC only 561. Either BTC just runs faster (it usually does), or we get a long 1976-style basing phase first, gold chopped sideways ~14 months after its low before wave 3 carried. If so, shift the time targets toward 2030. Invalidation: sustained break below ~$50k weakens it, below $35.6k (0.786) it's dead. n=1, not advice. What do you think @RobertPrechter? $BTC $GLD #Bitcoin #ElliottWave #Gold
capTEN tweet media
English
0
1
3
156
Norris Digital Assets ⚡️
Norris Digital Assets ⚡️@AssetsNorris·
$BTC Just found something crazy 🚨 This is one of the craziest charts out there Both of these charts are an exact match for Elliott Fibonacci The wave 1 through 3 rise, provides the basis for measuring the distance to the orthodox top. The formula is first 3 waves X .618, then add that number to the top of 3, to find wave 5 peak (See the green, follow the purple arrows) Both of these charts: 5 wave moves were around ~800 days The London Gold Bullion chart from 1974 has the exact same Fibonacci ratio formula pointing to its wave 5 peak within $1 They are nearly IDENTICAL moves
Norris Digital Assets ⚡️ tweet mediaNorris Digital Assets ⚡️ tweet media
English
21
30
215
47K