AnnieC

270 posts

AnnieC banner
AnnieC

AnnieC

@CollierAnnie

Adopted a rescue dog, named him Nicky, but everyday would call out different names. He finally answered to a name - Batman! I adopted a superhero.

Los Angeles, CA Katılım Mart 2012
510 Takip Edilen127 Takipçiler
AnnieC
AnnieC@CollierAnnie·
@argulian RVH & hyperdynamic, looks thicker than LV, RAE. Bubble study?
English
0
0
0
15
Edgar Argulian
Edgar Argulian@argulian·
Technically difficult transthoracic echo due to poor windows. Concern about right atrial echo density, the best view shown. Fact or artifact? What is the next step?
English
13
7
39
4.3K
AnnieC
AnnieC@CollierAnnie·
@MDBeni @VerwerftJan Is this for continuity equation? Is there, do you know, info re LVOT for stroke volume only not aortic stenosis? And the SV with closing click validated? I enjoyed your post. Ty.
English
0
0
0
9
Benigno Valderrábano Salas
🫀 Did you know where the recommendation to place the pulsed wave Doppler sample volume 0.5–1 cm from the aortic valve to measure LVOT VTI comes from? The answer is more interesting than it seems. It doesn’t come from a single study or an experiment designed for that purpose. It comes from a historical chain spanning nearly 40 years: 🔬 1982–1984 — The physical foundation Pasipoularides and Murgo demonstrated using invasive catheters and mathematical models that in aortic stenosis there is a real zone of flow acceleration in the LVOT, just proximal to the valve, without any second anatomic obstruction. Pure hemodynamics — no Doppler yet. 👉 Bird et al. Circulation 1982 → doi.org/10.1161/01.CIR… 👉 Pasipoularides et al. Am J Physiol 1984 → doi.org/10.1152/ajphea… 📐 1984 — The apical 5-chamber view Lewis, Kuo and Quinones were the first to validate cardiac output measurement using pulsed wave Doppler from the cardiac apex. They described placing the sample volume “immediately proximal to the aortic valve leaflets” — but without specifying any distance in centimeters. 👉 Lewis et al. Circulation 1984 → doi.org/10.1161/01.CIR… 📏 1985 — The first numerical distance Skjaerpe, Hegrenaes and Hatle (the Norwegian group) were the first to quantify this in Doppler: they empirically observed that flow acceleration began 0.5 to 1.5 cm proximal to the valve, and placed the sample volume just proximal to that zone. They directly cited Pasipoularides as supporting evidence. This was the first time a numerical distance appeared in the technique. 👉 Skjaerpe et al. Circulation 1985 → doi.org/10.1161/01.CIR… 📊 1986–1988 — Practical consolidation Otto et al. used ~1.0 cm. Oh, Tajik and the Mayo Clinic group explicitly established the range of 0.5 to 1.0 cm in 100 patients, justifying it as necessary to avoid the subvalvular acceleration zone. This is the figure we all recognize today. 👉 Otto et al. JACC 1986 → doi.org/10.1016/S0735-… 👉 Zoghbi et al. Circulation 1986 → doi.org/10.1161/01.CIR… 👉 Oh et al. JACC 1988 → doi.org/10.1016/0735-1… 📋 2002 — It becomes “official” Quinones, Otto, Zoghbi and colleagues codified it in the ASE guidelines as “~5 mm proximal to the aortic valve”… but without citing any specific study to support it. It had already become expert consensus. 👉 Quiñones et al. JASE 2002 → doi.org/10.1067/mje.20… ⚔️ 2017 — The debate reopens Baumgartner et al. (EACVI/ASE) maintained the 0.5–1 cm recommendation. However, Hahn and Pibarot responded with a critical letter pointing out that the original articles from the 1980s measured at the aortic annulus, not 0.5–1 cm below it, and that moving away from the annulus introduces errors due to the elliptical and irregular shape of the subannular LVOT. 👉 Baumgartner et al. Eur Heart J Cardiovasc Imaging 2017 → doi.org/10.1093/ehjci/… 👉 Hahn & Pibarot. JASE 2017 → doi.org/10.1016/j.echo… 💡 Bottom line: The 0.5–1 cm figure was never experimentally validated as the optimal distance. It emerged from empirical observations in the 1980s aimed at avoiding a flow acceleration zone that had been demonstrated with invasive catheters. It was adopted through accumulated clinical practice and later elevated to a formal recommendation by consensus. The debate over whether to measure at the annulus or 0.5–1 cm below it remains open to this day. One of those recommendations we all follow but few know where it actually came from 🙂 Dr Benigno Valderrábano Salas @MDBeni @JaeKOh2 @ottoecho @WilliamZoghbi @ASE360 @EACVIPresident @NephroP @iamritu @PPibarot @hahn_rt @MAecocardio @SISIACOficial @SONECOM_AC @VazyurVasquez @Cardiotweets83 @HEARTof_echo @echobasics
Benigno Valderrábano Salas tweet media
English
17
132
409
53.8K
AnnieC
AnnieC@CollierAnnie·
@TrackYourHeart The image does not show leading edge to leading edge.
English
0
0
0
10
CardiovascularCorner
CardiovascularCorner@TrackYourHeart·
Aortic Measurements in Echocardiography Accurate aortic measurements are vital for assessing valve function and diagnosing aortic pathology: LVOT Diameter (A): Measured in mid-systole to calculate transaortic stroke volume or valve area via the continuity equation. Aortic Measurements at End-Diastole: - Sinuses of Valsalva (B) - Sinotubular Junction (C) - Mid-Ascending Aorta (D) Technique Tip: Measurements should be taken using the leading edge–to–leading edge method. In TTE: outer anterior wall → inner posterior wall In TEE: outer posterior wall → inner anterior wall Source: Catherine M. Otto
CardiovascularCorner tweet media
English
5
61
288
16K
AnnieC
AnnieC@CollierAnnie·
@Ahmedata7777 Your #3 TR, does not match PAAT or the 60/60 sign.
English
0
0
0
5
Ahmed Ata
Ahmed Ata@Ahmedata7777·
🫁 Acute PE vs Chronic Pulmonary Hypertension – Echo Differentiation 1️⃣ Right Heart Thrombus Acute PE → May see mobile thrombus in RA/RV Chronic PH → Usually absent. 2️⃣ RV Free Wall Thickness Acute PE → RV wall ≤ 5 mm (no time for hypertrophy) Chronic PH → RV wall > 5 mm (long-standing pressure overload → hypertrophy) 3️⃣ Tricuspid Regurgitation Pressure Gradient (TRPG) Formula: 4 × (TRVmax)² Acute PE → TRPG usually ≤ 46 mmHg (TRV ≤ 3.4 m/s) Chronic PH → TRPG > 46 mmHg (TRV > 3.4 m/s) 👉 Chronic disease produces sustained high pulmonary pressures. 4️⃣ Pulmonary Artery Acceleration Time (PAAT) Acute PE → Very short (≤ 60–80 ms) Chronic PH → Short but typically < 105 ms Shorter PAAT = higher pulmonary pressures. 5️⃣ 60/60 Sign (Suggests Acute PE) Combination of: TRPG ≤ 60 mmHg PAAT ≤ 60 ms 💡 Moderately elevated RV pressure + very short acceleration time → acute obstruction. 6️⃣ Pulmonary Artery Early Systolic Notching Seen in proximal, higher-risk acute PE Reflects sudden increase in pulmonary vascular resistance. 7️⃣ McConnell’s Sign (Acute PE) RV free wall akinesia with apical sparing Suggests acute RV ischemia due to PE. 8️⃣ Right Atrial Enlargement Acute PE → RA ≈ LA Chronic PH → RA > LA (long-standing pressure overload) 🎯 One-Sentence Clinical Pearl Normal RV wall thickness with RV dysfunction strongly favors acute PE, while RV hypertrophy indicates chronic pulmonary hypertension.
Ahmed Ata tweet media
English
1
61
178
5.9K
Mizuko
Mizuko@callmeMizuko·
99.9% will fail..!! Tell me the number that is bigger than this..??
Mizuko tweet media
English
18.9K
255
3.3K
2.2M
AnnieC
AnnieC@CollierAnnie·
@NMerke But you should measure at a sweep speed of 100 not 50.
English
0
0
1
17
Nicolas Merke
Nicolas Merke@NMerke·
2 faces of post surgical #echofirst mean gradient after biological mitral valve replacement 7 mmHg or 4 mmHg What is the true value? Correct measurement is 🔑 for management
Nicolas Merke tweet mediaNicolas Merke tweet media
English
5
3
29
4.3K
CardiovascularCorner
CardiovascularCorner@TrackYourHeart·
1. What is the name of the sign? 2. What condition is it clinically associated with?
CardiovascularCorner tweet media
English
11
34
229
36.6K
CardiovascularCorner
CardiovascularCorner@TrackYourHeart·
Diagram of a parasternal long-axis view illustrating where aortic dimension measurements should be made: 1. Aortic annulus 2. Midpoint of the sinuses of Valsalva level 3. Sinotubular junction level 4. Mid ascending aorta Note: Measurements should be made perpendicular to the long axis of the aorta.
CardiovascularCorner tweet media
English
2
48
166
11.7K
AnnieC
AnnieC@CollierAnnie·
@TrackYourHeart ASE just published July 2025, guidelines on diastology, including parameters required for assessment,they don’t exactly match up with this.
English
0
0
0
8
AnnieC
AnnieC@CollierAnnie·
@TrackYourHeart The Doppler signal should have a closing click as well, so many pics don’t show that.
English
0
0
0
11
CardiovascularCorner
CardiovascularCorner@TrackYourHeart·
What is VTI (Velocity Time Integral) in echocardiography? VTI measures the distance a column of blood travels during systole through the LVOT. It’s a vital parameter to estimate stroke volume and cardiac output noninvasively. How is VTI measured? 1️⃣ Obtain an apical 5-chamber view (5C). 2️⃣ Place PW Doppler just below the aortic valve (at LVOT). 3️⃣ Measure the area under the velocity curve during systole➡️ that’s the VTI (in cm). Calculation of Stroke Volume (SV): SV = VTI × LVOT area LVOT area = π × (LVOT diameter/2)² Requires accurate LVOT diameter from parasternal long-axis view. Then, Cardiac Output (CO) = SV × HR ♦️Normal LVOT VTI: ~18–22 cm (adults) ▶️A low VTI often means reduced stroke volume, requiring further hemodynamic assessment. #Echo #Cardiology #VTI #StrokeVolume #CardiacOutput #POCUS
CardiovascularCorner tweet media
English
2
68
222
11.1K
AnnieC
AnnieC@CollierAnnie·
@AntonioBarros_ I bet it’s an imaging error. I haven’t read the article yet, often what is written does not correlate with the image. You see this with SV all the time: says have a closing click & image does not.
English
0
0
2
235
AnnieC
AnnieC@CollierAnnie·
@alex1708ander Shouldn’t stroke volume always have a valve click, closing click?
English
0
0
0
34
Alexander Mladenow MD
Alexander Mladenow MD@alex1708ander·
#echofirst when calculating forward stroke volume across LVOT & RVOT by pulse wave Doppler, appropriate TEE views for LVOT & RVOT VTI are needed
English
3
28
82
6.5K
AnnieC
AnnieC@CollierAnnie·
@kyliebaker888 @cardiacACCP Yes but less than 20 is acceptable in echo, we strive for 0 though, and why we should all use the Pedoff probe.
English
0
0
1
8
kylie baker
kylie baker@kyliebaker888·
The thing that always worries me is how important is it to get the exact doppler angle? - particularly when I see images like the one in the salmon background- which is common in PoCUS. The echocardiographers do not use angle correct - but should we?
Gokul Sagar@gokpocus

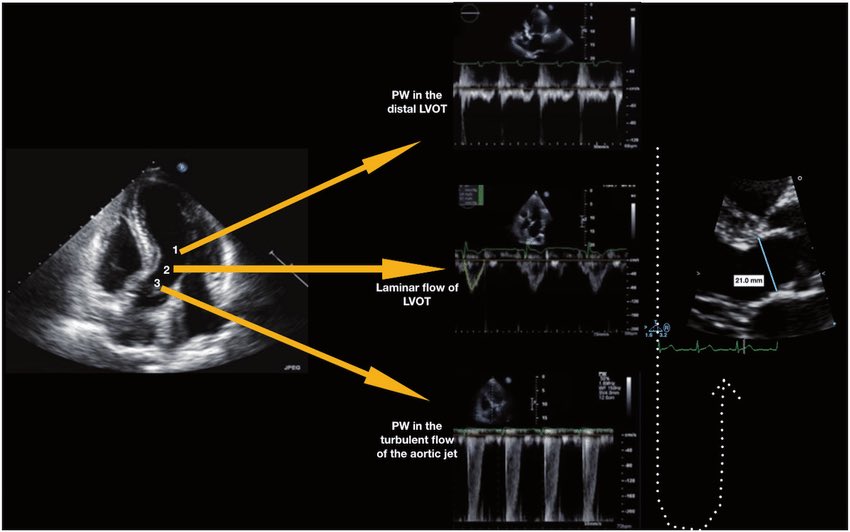
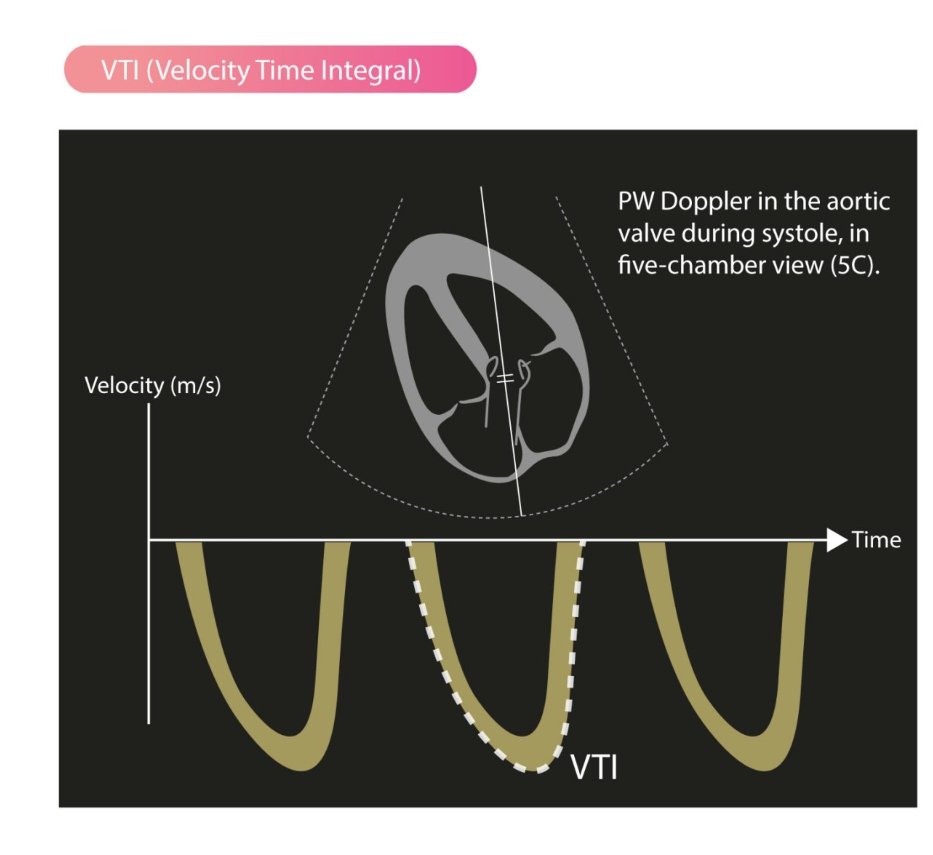
LVOT Vti: A Surrogate for Stroke Volume! 🔍 - Get a good PLAX view: Zoom in on the LVOT. - Measure LVOTd: Measure the LVOT diameter just proximal to the aortic valve at mid-systole. - Use PW Doppler: In A5C/A3C, place PW Doppler just proximal to the aortic valve. - Get a clean trace: Look for a clear Doppler signal with the aortic valve closing click. - Measure LVOT VTi: trace the modal velocity of the envelope! let the machine do the rest. This gives you an estimate of stroke volume! #POCUS #Shock #StrokeVolume #emergencymedicine #Scanuary Pitfalls : LVOTd measurement can be subject to error this will cause a big difference in your SV. So be careful!

English
4
7
27
7.1K
AnnieC
AnnieC@CollierAnnie·
@NephroP Doc B seriously not a cardiologist
English
0
0
1
42
NephroPOCUS
NephroPOCUS@NephroP·
#POCUS quiz of the day Doc A 👨‍⚕️: "RV is bigger than the LV - severely dilated" Doc B 👨‍⚕️: "No, LV > RV. It's just that the image is flipped" Who is right? #FOAMed #Nephpearls
GIF
English
13
17
72
13.3K
AnnieC
AnnieC@CollierAnnie·
@NephroP Aorta, transverse sinus, coronary sinus
Català
1
0
1
562