
JumpManTrades
909 posts

S&P down 1.26%. OPEX. The tape bought +$9.5B. Seven of eight names net buy.
OPEX day. Yields at 4.59%. Record 11.5% rotation spread. $SLV -8.5%. $NVDA -3.6%. Powell's last day at the Fed. The internals showed distribution.
The tape bought into all of it.
$36.1B in buy blocks. $26.5B in sells. Net flow: +$9.52B. Buy/sell ratio: 1.4 to 1. 29,083 prints.
The buyers:
$QQQ +$5.16B (4,523 blocks)
$SPY +$3.57B (3,472 blocks)
$MSFT +$2.25B (1,331 blocks)
$AAPL +$2.22B (790 blocks)
$META +$1.28B (441 blocks)
$IWM +$179M (431 blocks)
The sellers:
$MU -$2.00B (3,813 blocks)
$NVDA -$193M (3,018 blocks)
The pattern holds. Every time the market has sold off this month, the institutions have bought into it.
CPI day (May 12): S&P down, tape +$3.56B (closing cross),
PPI day (May 13): S&P flat, tape +$15.8B,
OPEX day (May 15): S&P -1.26%, tape +$9.52B.
Three sell-off catalysts. Three net buy sessions. The institutions are not selling into bad news. They're accumulating.
$QQQ at +$5.16B leads the tape. The Nasdaq is being bought heavily on the OPEX sell-off. $SPY at +$3.57B. Both indexes accumulated. $MSFT +$2.25B, $AAPL +$2.22B, and $META +$1.28B. Five mega-cap names on the buy side. The broadening from individual names to broad index accumulation continues.
$NVDA: -$193M. Barely negative. After four straight buy sessions, the OPEX gamma unwind pushed $NVDA to a marginal sell. Five days to earnings (May 20). The $NVDA positioning heading into earnings: four buy sessions followed by a nearly flat OPEX day. The institutions are holding their positions.
$MU: -$2.00B. Third straight session as the top seller. The $MU sell pattern is now as persistent as the $NVDA sell pattern was two weeks ago. The memory trade that produced the $13.4B zero-sell record on May 8 has completely reversed.
$IWM at +$179M. Small caps being bought on an OPEX day. That showed up in the dark pool earlier this week too. The institutional interest in small caps is quiet but consistent.
The tape has been net buy in 7 of the last 8 sessions despite CPI, PPI, OPEX, yields at 4.55%, and a Fed chair transition. The institutions are telling you something.
The tape doesn't have an opinion. It has a receipt.

English
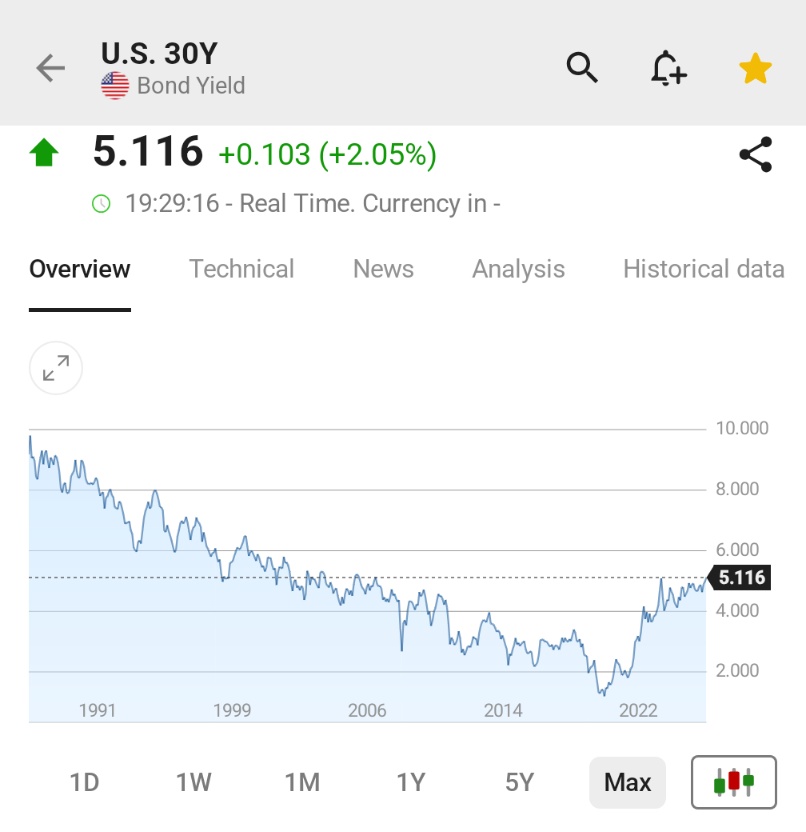
@Investingcom So why does everybody care now? It's been rising since 2022.....
English

*US 30-YEAR TREASURY YIELD RISES TO 5.12%, HIGHEST SINCE JUNE 2007
🇺🇸🇺🇸
English
@alphaticaio Day 9 of 20.8 for edge can you explain that again? You said the start of the wedge had a 6% up move and then after 20 days it would break? Maybe I'm messing it up just trying to clarify
English
SPY OPEN | Friday May 15 | Monthly OpEx | Warsh Day 1
$740.97. Down 0.96%. The gamma cliff arrived. The dip is getting bought.
Composite: +18.3 [Neutral, bullish side]
The structure lost 1% overnight and the composite still reads positive. That tells you the dip-buying is real. Here's what the first two hours look like on the most structurally significant day since April 17.
THE GAMMA CLIFF IN REAL-TIME:
53.6% of all open interest expires today. 4.39M contracts. 3.42M puts. More than half the options chain dies by 4 PM. We've mapped this date for three weeks. It arrived.
GEX: -$406M. Negative. Dealers are amplifying. But compare this to the pre-market reading of -$1.18B. The structure improved $774M in the first two hours. The dip buyers aren't waiting for the close. They're building into the rolloff.
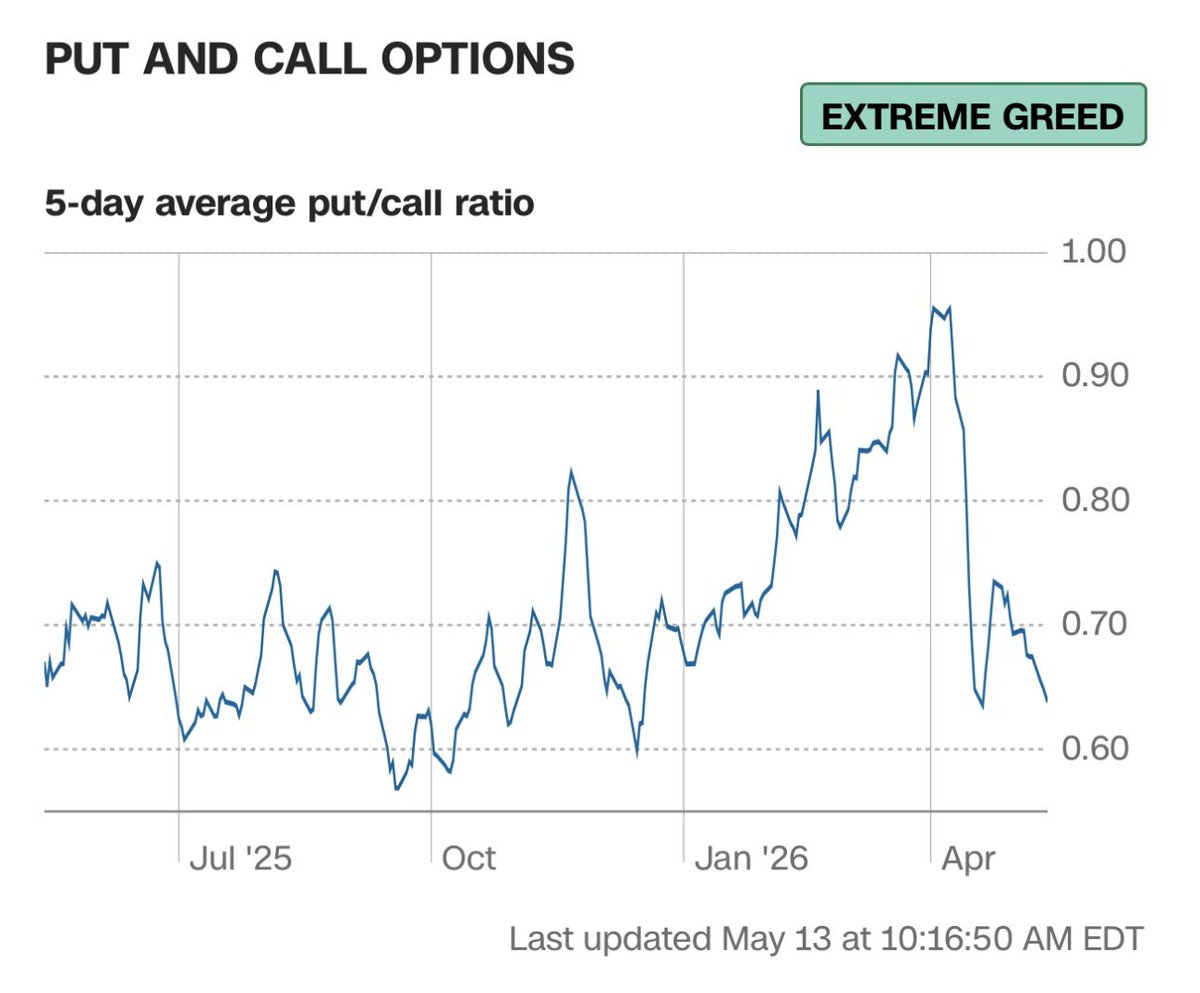
P/C ratio: 3.59. New all-time high. Three and a half puts for every call. The highest hedging ratio of the entire cycle. At the exact moment the gamma cliff hits. The institutions aren't removing protection on the selloff. They're adding more.
Daily flow: +15.3M shares long. Bullish. On a -0.96% down day. Call premium: +$186M at 66% call-heavy. Someone is buying this dip with conviction.
Call Vol/OI: 83.5%. Massive new call positions opening. 1.30M new calls opened against 1.22M new puts. The call building is outpacing the put building on a down day. That's not panic selling. That's positioning for the bounce.
THE ACCELERATOR MAP:
Below price:
$739: -$64M (0.3% below)
$738: -$90M (0.4% below)
$736: -$38M (0.7% below)
$735: -$82M (0.8% below)
$730: -$106M (1.5% below)
Above price:
$745: +$81M (0.5% above)
$750: +$72M (1.2% above)
$755: +$57M (1.9% above)
The accelerators are closer and larger than the magnets. The near-term structure favors the downside. But the magnets above are still there, and the flow is pushing toward them.
GEX flip: $711. Cushion: 4.1%. The floor reset from the pre-market $667 as the monthly gamma concentrated. Still a meaningful cushion. A 4% crash to break the floor.
WARSH'S FIRST DAY:
Kevin Warsh was confirmed 54-45 on Wednesday. The most partisan Fed chair vote in history. Today is his first day. His first FOMC meeting is June 16-17. No statement expected today, but every word he says from now on moves markets.
The key question: does Warsh signal alignment with Trump's rate cut demands or independence like Powell? He inherits 3.8% CPI, 6.0% PPI, and three hawks who dissented. The data doesn't support cuts. Trump demands them. Warsh's positioning on that tension defines the summer.
THE SUMMIT:
Trump-Xi ended without a Hormuz breakthrough. Both agreed the Strait must remain open but no framework for reopening. Oil back above $104. The sell-the-news setup we mapped played out exactly.
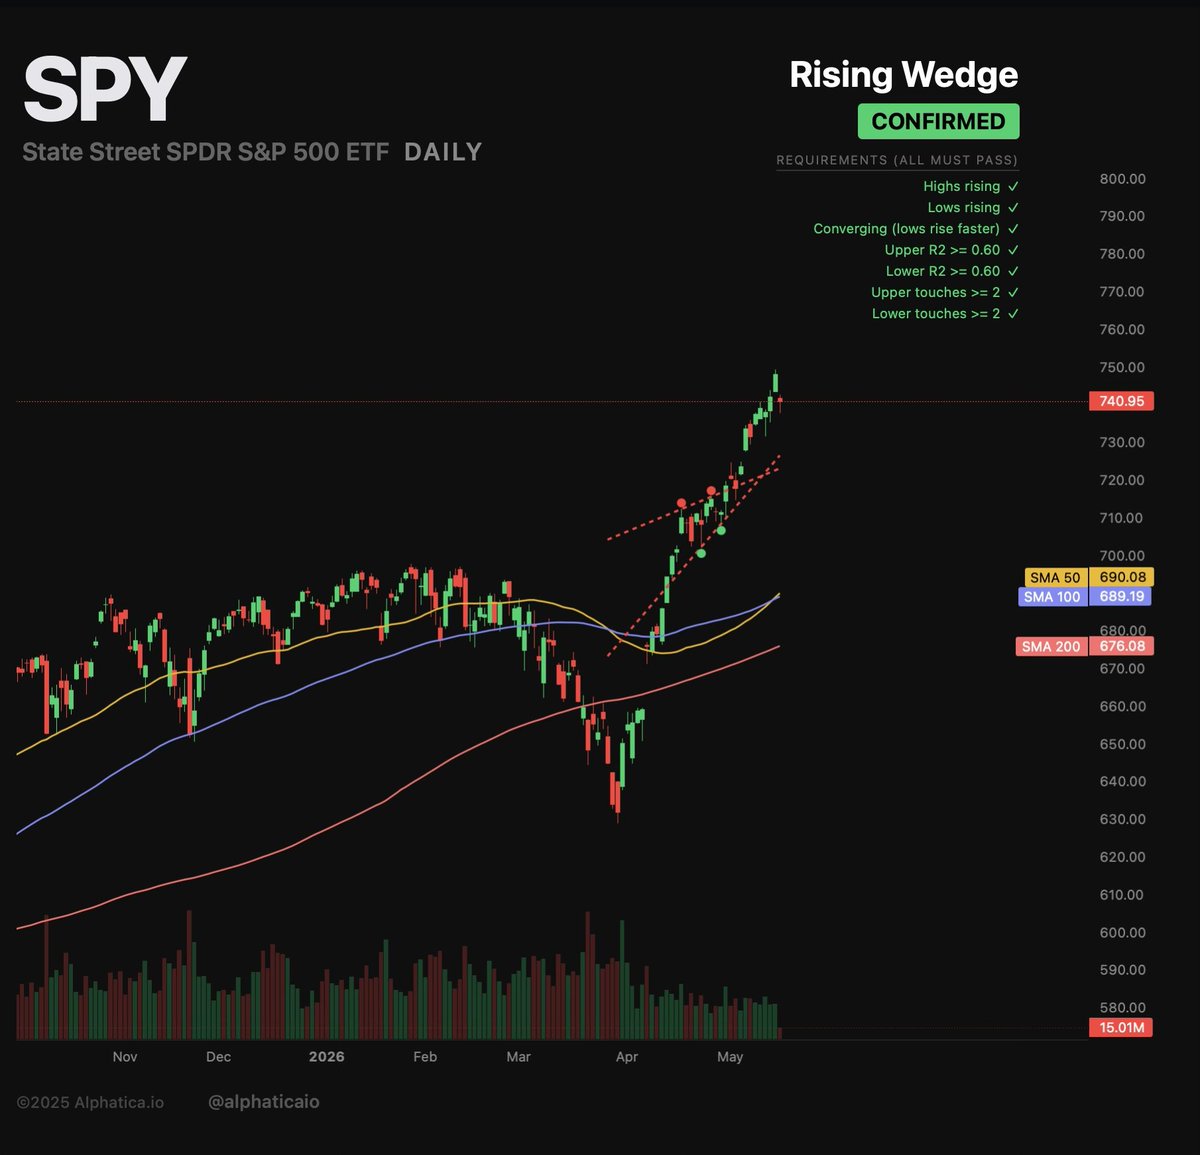
RISING WEDGE:
Day 9 of 20.8. Price at $740.97. Detection at $732.28. The adverse move peaked at $748.17 yesterday (+2.2%). Today's selloff is pulling price back toward the breakdown. If we close below $732 with the gamma cliff draining the structure, the pattern confirms into the thinnest blanket since April.
Current distance to breakdown: $740.97 to $732.28 = 1.2%. Eight dollars.
WHAT TO WATCH INTO THE CLOSE:
$745 magnet above. If the dip-buying continues and the monthly gamma rolloff is orderly, price gravitates back toward $745 as the expiring puts decay.
$730 accelerator below. If the selling resumes and the accelerators fire, $730 is the target. Below that, $711 GEX flip.
$732 rising wedge. If price touches $732 on the gamma cliff day with the summit disappointing and Warsh taking over, every bear signal we've tracked converges in one session.
The bottom line:
The gamma cliff arrived. Price dropped 1%. The dip is getting bought. Flow bullish on a down day. P/C at all-time highs. Call positions opening at the fastest rate of the week.
The structure is amplifying moves. The calendar is draining gamma. The dip-buyers are fighting both. The next six hours decide whether the cliff was a reset or a reversal.
$745 is the magnet. $730 is the accelerator. $732 is the wedge line. $711 is the floor. Day 9 of 20.8.
$SPY $QQQ $VIX
English
@KTTECHPRIVATE 🤯💥 yes you did. I'm trying to figure a way and a timeframe I csnuse your charts for credit spreads. It seems you do more higher time frame in the members pre week breakdowns may try figure it out form there.. I chicken out at 20% gains too often but your plays do often play out
English
@alphaticaio Thanks looks like futures getting an early start on that gamma roll off
English
@JumpManTrades This is not going to play out. Here are your worries in order:
1. New Fed Chair
2. Bond Yields
3. Inflation
$SPY $SPX $QQQ
English
For our new followers: this is the research FinTwit didn't want to hear when oil was at a YTD high.
WTI spiked to ~$107 on the Strait of Hormuz closure. We published the $100 Oil Stress Timer.
The framework:
$100 oil isn't the signal. $100 oil for 30+ days is. Supply-driven spikes are sharper, shorter, and mean-revert.
$107 to $91 in one week. The stress timer reset before reaching the 30-day threshold. The data held.
Full study, methodology, and duration-dependent decay tables in the thread below.
Keep this one bookmarked. Fintwit can drive you crazy on higher oil prices. Remember higher oil is a supply side story, not a demand one.
$SPY $SPX $QQQ $USO $OIL
Alphatica@alphaticaio
WTI crossed $100 on March 27. The clock is ticking. $100 oil isn't the signal. $100 oil for 30+ days is. We analyzed every trading day WTI spent above $100 since 2003. 547 days. Then measured SPY forward returns at each duration threshold. The results are statistically significant at P < 0.0001 across 7 of 8 tests. What we found: SPY forward returns deteriorate monotonically the longer oil stays above $100. The market can absorb a spike. What it can't absorb is sustained pressure. The numbers: → ≥1 day above $100: SPY 10d return -0.28% → ≥30 days: -0.54% (win rate drops below 50%) → ≥50 days: -1.33% → ≥100 days: -1.40% (10d), -6.86% (20d) → ≥120 days: -3.81% (10d), -13.43% (20d), 0% win rate The baseline SPY 10d return is +0.38%. At ≥30 days above $100, that flips negative and never recovers. This isn't a round-number artifact. The same duration-dependent decay appears at $90 and $110. It's a fundamental relationship. Sustained high oil acts as a margin tax on the entire economy, and the market has a tolerance window of roughly 30 days before it starts to crack. The important caveat: the extreme results (≥100 days) are disproportionately 2008-weighted. The pattern held in 2011–2014 with smaller magnitude, and held again in 2022 where SPY fell ~11% across the full March–July regime when oil repeatedly crossed above $100. The direction is consistent. The effect size is regime-dependent. If this is a brief spike, history says equities shrug it off. If oil sustains above $100 for 30+ days, every analog except 2013 shows the market breaking. $SPY $QQQ $VIX $USO #WTI #OIL
English
@alphaticaio When you see gamma spread like this for may 15 how do you read it? Is it more likely to pull to the higher mark or sit in between when calls are already like this above and below current price?
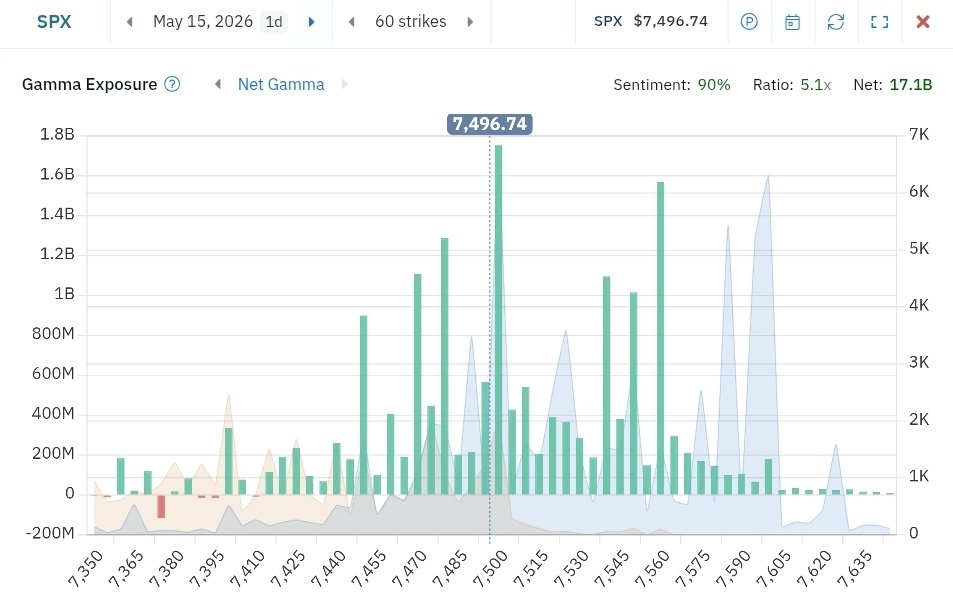
English
SPY OPEN | Thursday May 14
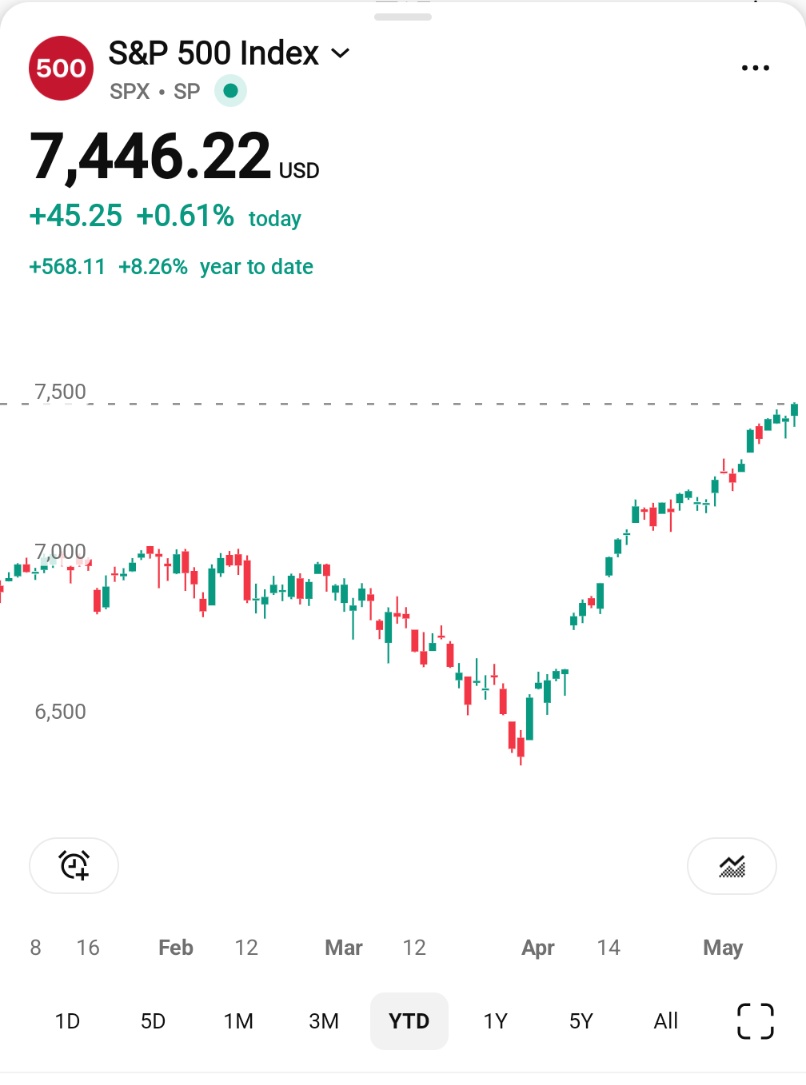
$746.03. Up 0.50%. SPX 7,462.
Target hit.
In March, when SPX was in the low 6,600s, we published a year-end target of 7,462. Fintwit was calling for a crash. The consensus was lower. We said the mechanics pointed higher.
The market reached our December target in May. Every dollar of the move was tracked. Every magnet, every accelerator, every dealer short, every GEX reading, every composite score. From the April 7 ceasefire to the 13-day rally. Through the FOMC crisis and mega-cap earnings. Through the rising wedge and the CPI/PPI buy signal. The receipts are on the timeline.
THE SUMMIT:
Trump and Xi agreed Hormuz must remain open. China opposes the militarization of the Strait and any tolling system. Both agreed Iran can never have a nuclear weapon. China expressed interest in buying more US oil to reduce Middle East dependence. Trump called the meeting "extremely positive." The summit continues through tomorrow.
This isn't a deal. It's a framework. But it's the first time both the US and China publicly aligned on reopening Hormuz. That changes the calculus for Iran. The diplomatic pressure is now bilateral.
Oil is repricing the probability of Hormuz reopening. The inflation narrative that produced 3.8% CPI and 6.0% PPI starts to reverse if energy flows normalize.
THE STRUCTURE:
Composite: +25.6 [Lean Bullish]
Dealers short 204.0M shares. Near the mechanical maximum. The engine is at full power heading into tomorrow's OpEx.
GEX: +$887M. All 10 top GEX levels are magnets. Not a single accelerator:
$745: +$249M (at price)
$746: +$98M
$747: +$104M
$748: +$71M
$749: +$69M
$750: +$232M (0.5% above)
$755: +$115M (1.2% above)
$760: +$72M (1.9% above)
$1.01B of magnets from $745 to $760. Pure runway. The structure is pulling price toward $750.
GEX flip: $683. Cushion: 8.4%. The floor is far and stable.
Flow: +32.2M shares. Bullish. +$965M into calls at 83% call-heavy. Call volume exceeding put volume for the first time since the rally started. The P/C volume ratio flipped to 0.74. More calls trading than puts. That's a shift.
$700 put OI: 418K. The fortress below continues to build. The institutions aren't removing hedges on the summit headlines. They're maintaining them.
IV: 16.0%. Slightly above realized (13.3%). Options still pricing more risk than the market is delivering. The vol premium persists heading into tomorrow's event.
TOMORROW: MAY 15
Monthly OpEx: 4.18M contracts. 3.30M puts. 24.3% of remaining gamma expires.
Warsh's first day as Fed Chair. His first statement. He inherits 3.8% CPI, 6.0% PPI, three hawks who dissented, and a committee at war with itself.
Trump-Xi summit concludes. Final statements. Any Hormuz framework gets formalized or doesn't.
The structure that posted these numbers today loses a quarter of its gamma tomorrow. The tight suppression that powered the grind becomes loose support by Friday morning.
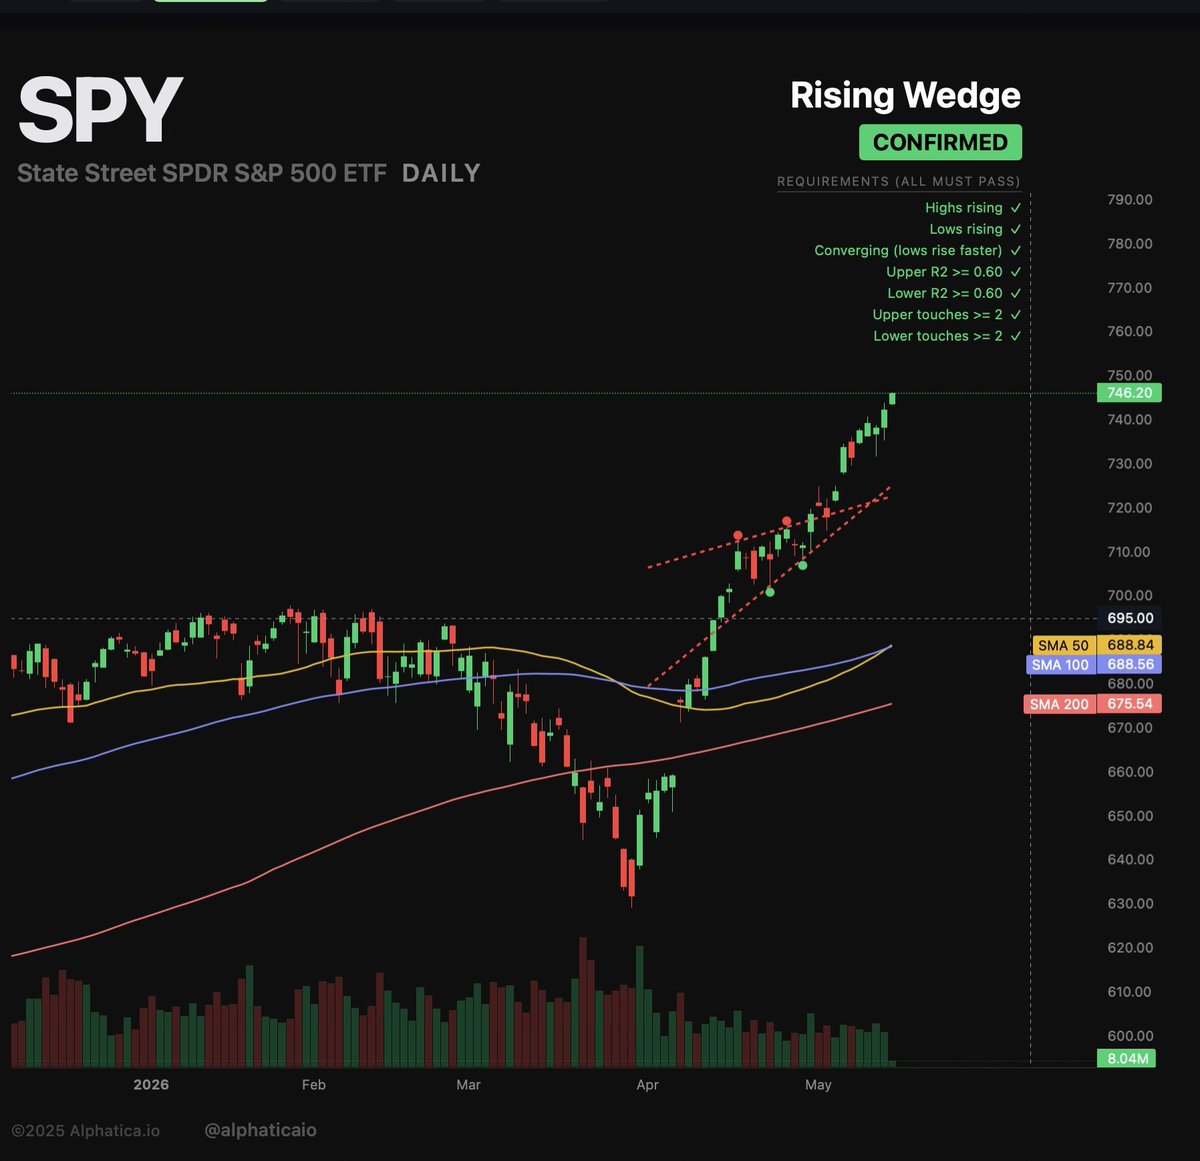
RISING WEDGE:
Day 8 of 20.8. Price at $746.03. Detection at $732.28. Adverse move running at +1.9%. The +6.42% average targets ~$779. Room to push higher. But the gamma cliff tomorrow changes the structural character. The wedge resolves into a thinner blanket.
WHAT COMES AFTER THE TARGET:
We're not revising upward today. The target was reached. The mechanics delivered. What comes next depends on three things that all resolve in the next 24 hours: the Hormuz framework, Warsh's tone, and the post-OpEx structure.
If all three are positive: the target becomes a floor and we reassess for $780-$800.
If mixed: the target becomes resistance and we consolidate.
If negative: the rising wedge activates into the thinnest gamma blanket since mid-April.
The bottom line:
SPX 7,462. The number we published when nobody believed it. The mechanics delivered. The summit is progressing. The structure is bullish with $1B of magnets to $760.
Tomorrow changes everything. Enjoy the target. Respect the cliff.
$746 is the pin. $750 is the magnet. $683 is the floor. Tomorrow is May 15. Day 8 of 20.8.
$SPY $QQQ $VIX $SPX
English


SAUDI WARPLANES STRUCK IRAN-BACKED MILITIA SITES IN IRAQ DURING WAR, SOURCES SAY
English
@TradingThomas3 Everyday they rotate into something else to keep the index green. That's called a ponzi scheme
English

FED'S COLLINS SAYS SHE COULD ENVISION THE NEED FOR RATE HIKES
English
@colin_gladman Exactly common sense has been done . Fake ceasefires and worst inflation in 3 years and people buy every 10pt dip in SPx. Crazy 💊
English

But who cares?
Markets are up and Trump promised me not to worry.
The Kobeissi Letter@KobeissiLetter
BREAKING: April PPI Inflation surges to 6.0%, well above expectations of 4.9% and the highest level since January 2023. Core PPI Inflation rose to 5.2%, above expectations of 4.3%. Both CPI and PPI Inflation are now officially at 3+ year highs. Odds of rate HIKES are rising.
English
@ddw88523 I guess people didn't trade in 2022 when inflation was bad . This market is going to be done 5% one day and two months of work will disappear for the people who are supposed to know what they are doing.
English

@Mr_Derivatives Remember the days in 2022 when any hint if inflation getting worse was bad? Now we buy the dips with the worst inflation in 3 years. 😂 These guys get what they deserve when the crashes come.. morons
English

$SPX Every microdip scooped up like a Baskin Robbins ice cream.
The lock out rally continues.
English
@Nina_Beeeeeee @unusual_whales They did this in 2007 too. They always are late. Analysts are worthless they upgrade and downgrade stocks based on what wallstreet wants. They manipulate the retail investors every day and usually near tops the worst
English

@unusual_whales Morgan Stanley literally went from playing it safe last month to yelling 'charge to 8000' overnight. Analysts change their minds faster than flipping pages
English

Morgan Stanley says the year end target for the S&P500 is now 8000.
English
@unusual_whales Highest inflation in years and oil above $100 and fraudulent ceasefires... the saying the market doesn't like uncertainty is bullshit. This market going up on bad news is a rigged market.
English
@DeItaone Inflation arrives at Trump's front door 🚪. Highest since 2023 when he blames Biden all the time for it. I voted for him and he is failing the American people
English
@alphaticaio This was awesome call. Anything like this for tomorrow ppi? Love it
English
CPI came in hot. Here's how our research played out today.
SPY gapped down at the open (-0.33%) and closed down (-0.15%). Direction match: confirmed at every checkpoint.
9:30 AM: DOWN ✓
9:40 AM: DOWN ✓
10:00 AM: DOWN ✓
10:30 AM: DOWN ✓
12:00 PM: DOWN ✓
2:30 PM: DOWN ✓
🚨🚨6 for 6. Our research said the open direction predicts the close 72% of the time. Today it held.
The market dipped to -0.95% at 1:00 PM then bounced to -0.15% by the close. People called it a reversal. It wasn't. SPY opened down and closed down. The direction never flipped. The magnitude compressed but the signal held.
Hot CPI days drift lower all day. Today: -0.33% at the open → -0.95% by 1:00 PM → -0.12% at the close. The late-day bounce reduced the loss but didn't change the direction.
The 20-day buy signal has fired. Our research shows hot CPI 20-day forward returns average +0.88% with a 66% win rate (p = 0.034). The clock starts today. We will post the results.
$SPY $SPX $QQQ #CPI #inflation
Alphatica@alphaticaio
CPI prints at 8:30 AM tomorrow. The data from the research we posted on April 9, hasn't changed. 266 releases. 22 years. The direction at the open predicts the close 72% of the time. By 2:30 PM, 97%. Hot prints drift lower all day. Cool prints drift higher. No reversal. The one edge: if the print is hot and the market sells off, 20-day forward returns are +0.88%, 66% win rate (p = 0.034). Same three rules: Before 9:30: wait, By 10:00: direction is set, After 10:30: it's over. Don't fade the 8:30 reaction. $SPY $SPX $QQQ #inflation #cpi
English

You're driving, approaching an intersection
Light is 🟢
You think... "wow, it's been green a while. usually it's a quick light. and it's rush hour"
DO YOU STOP?!?!
Obviously not
Because before 🔴 comes 🟡
This is a trading analogy.
No matter how many reasons you have to think price may do something...
- RSI
- Moon phases
- VIX
- Jim Cramer
- etc
It all comes down to how price reacts.
If a reversal is going to form, it will start with a control shift. That's the yellow light.
If you've been fighting the rally this whole time, you've been stopping at 🟢 lights because you're scared of 🔴... Next time, just keep driving until you see 🟡
Today was our first yellow light, on the lower timeframes.
Chandler Trades@ChandlerTrading
And notice how easy it was to flip to downside focus when the evidence shifted No need to call top every day. No need to fight the rally. As soon as price gave us new evidence, we knew how to roll with it Trade what's in front of you. Save yourself the headache.
English
@Optuma You see that bears you just need to roll out your call spreads for 10 years lol
English

This is only the 3rd time that $SPX has been up 6 consecutive weeks with a 16% gain. 1962 & 2009 events came after major lows:

Charlie Bilello@charliebilello
The 16% gain in the S&P 500 over the last 6 weeks is the 11th biggest 6-week gain for the index since 1950. What's unique about this rally? It's the only example in the top 20 that did not occur either during a bear market or soon after a bear market low.
English