Mark Hackett

1.4K posts

Mark Hackett banner
Mark Hackett

Mark Hackett

@Markhackettcfa

Charts and market concepts that I find interesting. CFA, CFP®, and CMT. Views are my own, not investment advice.

Katılım Kasım 2011
1.5K Takip Edilen377 Takipçiler
Mark Hackett
Mark Hackett@Markhackettcfa·
@yieldsearcher Interesting, from 1974-2012, real income was coincident 6 for 6 with recessions, since, 1 for 4
Mark Hackett tweet media
English
1
0
1
187
Mr. VIX
Mr. VIX@yieldsearcher·
Real income growth (ex transfers). Note the late 90s tech boom (red box on the left) and today (red box on the right). AI productivity gains sure hitting differently.
Mr. VIX tweet media
English
7
15
69
5.6K
Mark Hackett
Mark Hackett@Markhackettcfa·
@Hedgeye The performance gap between bonds and equities is driving flows, further widening the gap
Mark Hackett tweet media
English
0
0
1
46
Hedgeye
Hedgeye@Hedgeye·
🇺🇸 U.S. 30-year yield hits 19-year high
Hedgeye tweet media
English
8
42
198
18.1K
Mark Hackett retweetledi
13F Pro
13F Pro@13F_Pro·
@LizAnnSonders Quits rate ticking up while hires accelerate. That's the sweet spot — people confident enough to job-hunt but employers still hungry for talent. Means wage pressure stays live and the Fed's got room to stay patient on cuts.
English
0
1
1
82
MTS Insights
MTS Insights@MTSInsights·
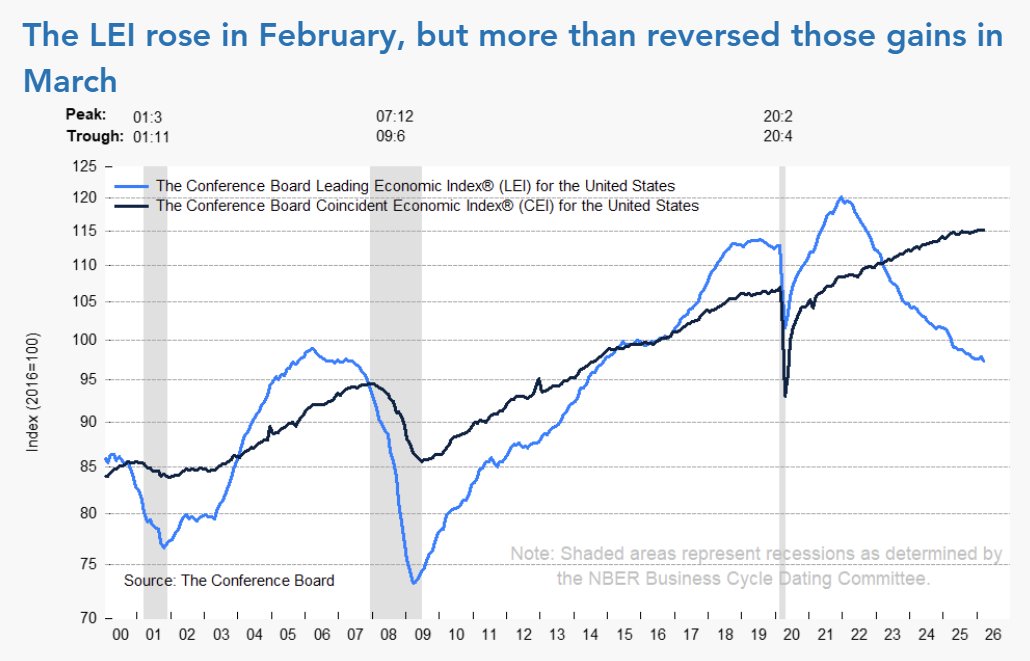
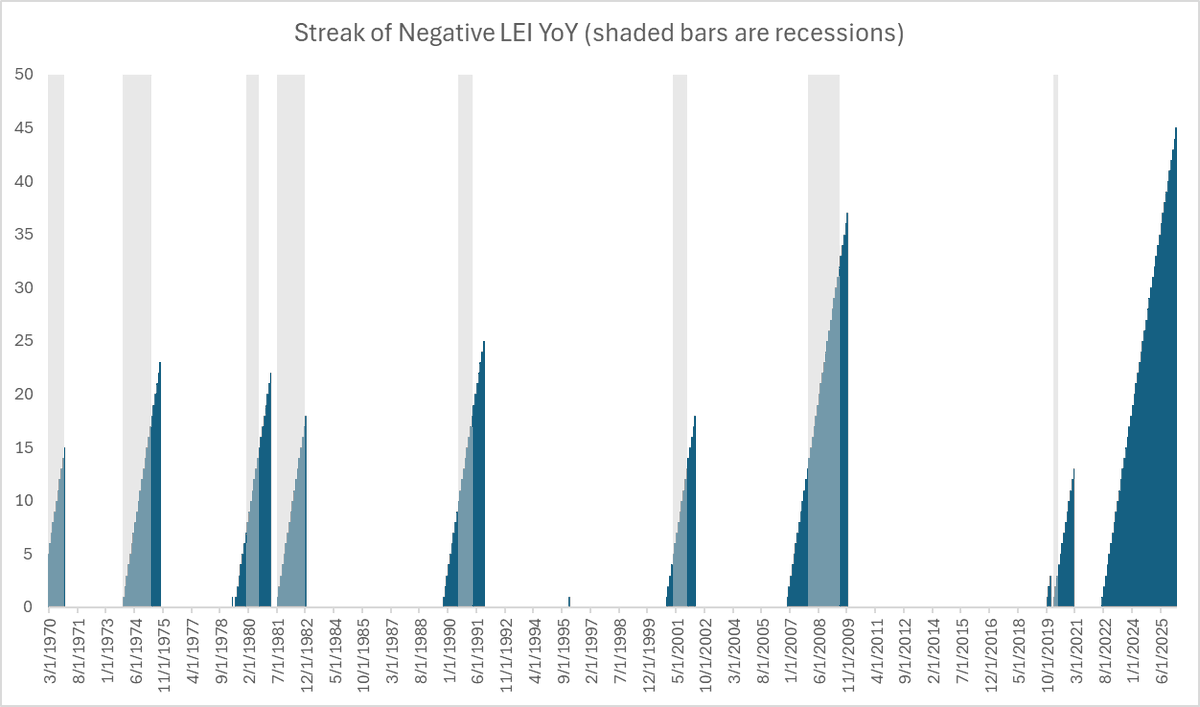
🇺🇸 The Conference Board Leading Economic Index (LEI) for the US declined by -0.6% MoM in March to 97.3, more than reversing its 0.3% MoM increase in February to 97.9. Overall, the LEI fell by -1.0% over the six months between September 2025 and March 2026, more than halving the rate of decline of its -2.1% contraction over the previous six-month period.
MTS Insights tweet media
English
1
2
1
111
Mark Hackett
Mark Hackett@Markhackettcfa·
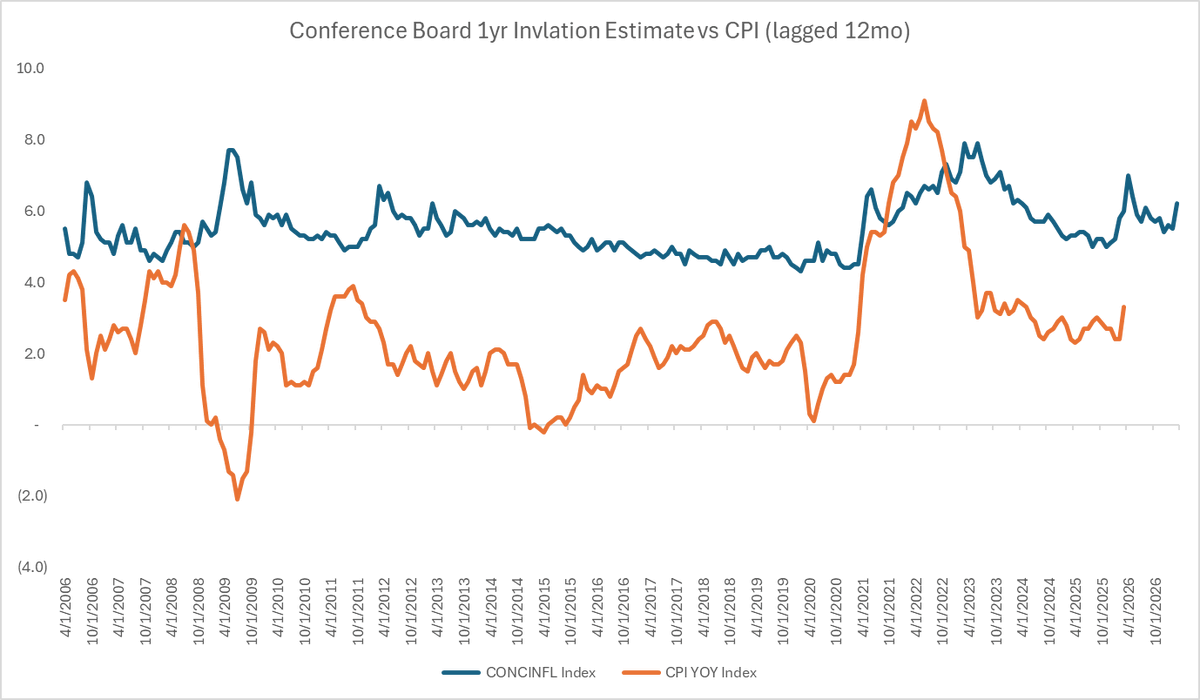
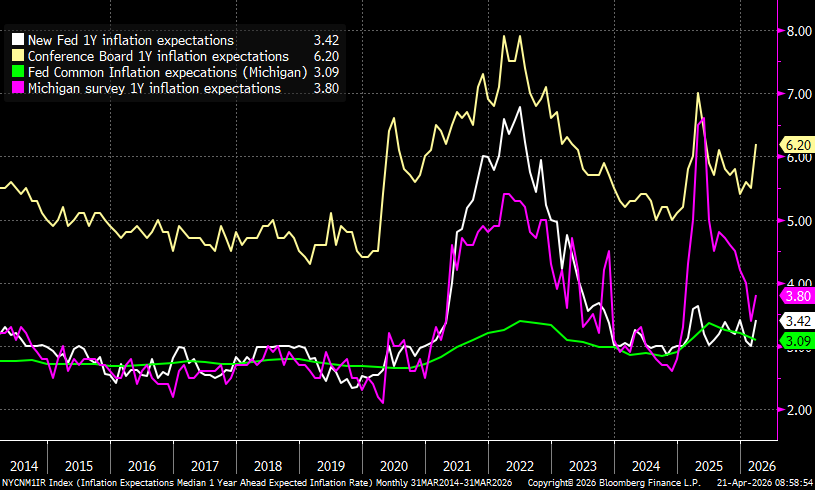
@Marcomadness2 To give an indication on how accurate the Conference Board stat is, I lag CPI so it matches up -- for example, the 3/26 stat is actual for CPI and was the 3/25 year forward estimate for Conference Board -- over the past 30 years, CPI has averaged 2.5%, estimate has averaged 5.1%
Mark Hackett tweet media
English
0
0
0
22
Global_Macro
Global_Macro@Marcomadness2·
The collection of inflation expectations
Global_Macro tweet media
English
2
5
16
1.7K
Milk Road Macro
Milk Road Macro@MilkRoadMacro·
LOTS OF MOVEMENT ON HORMUZ (LAST 48 HOURS) A wide range of ships are moving through but focus on the red markers. Those represent tankers carrying crude oil, chemicals, and LNG. Here’s the latest shipping data at Hormuz: 🟢 Feb 26 → 🚢 132 🟢 Feb 27 → 🚢 128 🟠 Feb 28 → 🚢 98 🟠 Mar 01 → 🚢 18 🟠 Mar 02 → 🚢 7 🔴 Mar 03 → 🚢 2 🔴 Mar 04 → 🚢 2 🔴 Mar 05 → 🚢 1 🔴 Mar 06 → 🚢 0 🔴 Mar 07 → 🚢 1 🔴 Mar 08 → 🚢 2 🔴 Mar 09 → 🚢 1 🔴 Mar 10 → 🚢 2 🔴 Mar 11 → 🚢 1 🔴 Mar 12 → 🚢 0 🔴 Mar 13 → 🚢 3 🔴 Mar 14 → 🚢 1 🔴 Mar 15 → 🚢 0 🔴 Mar 16 → 🚢 1 🔴 Mar 17 → 🚢 2 🔴 Mar 18 → 🚢 1 🔴 Mar 19 → 🚢 0 🔴 Mar 20 → 🚢 1 🔴 Mar 21 → 🚢 2 🔴 Mar 22 → 🚢 3 🔴 Mar 23 → 🚢 5 🔴 Mar 24 → 🚢 6 🔴 Mar 25 → 🚢 4 🔴 Mar 26 → 🚢 4 🔴 Mar 27 → 🚢 3 🟠 Mar 28 → 🚢 11 🟠 Mar 29 → 🚢 9 🟠 Mar 30 → 🚢 8 🟠 Mar 31 → 🚢 11 🟠 Apr 01 → 🚢 16 🟠 Apr 02 → 🚢 13 🟠 Apr 03 → 🚢 14 🟠 Apr 04 → 🚢 11 🟠 Apr 05 → 🚢 10 🟠 Apr 06 → 🚢 11 🟠 Apr 07 → 🚢 11 🟠 Apr 08 → 🚢 12 🟠 Apr 09 → 🚢 9 🟠 Apr 10 → 🚢 15 🟠 Apr 11 → 🚢 17 🟠 Apr 12 → 🚢 14 Source: @World_Insights1
Milk Road Macro@MilkRoadMacro

US-IRAN TALKS FAIL Here's everything you need to know: 1. The meeting lasted 20 hours. 2. Most points were close to agreement. 3. But the key issue of Iran’s nuclear program remained in contention. 4. Because of this, Trump has begun blockading ships in the Strait of Hormuz. 5. Trump has also ordered operations to clear mines from the Strait. We expect oil to rise on the back of this news.
English
9
37
154
96.2K
Mark Hackett
Mark Hackett@Markhackettcfa·
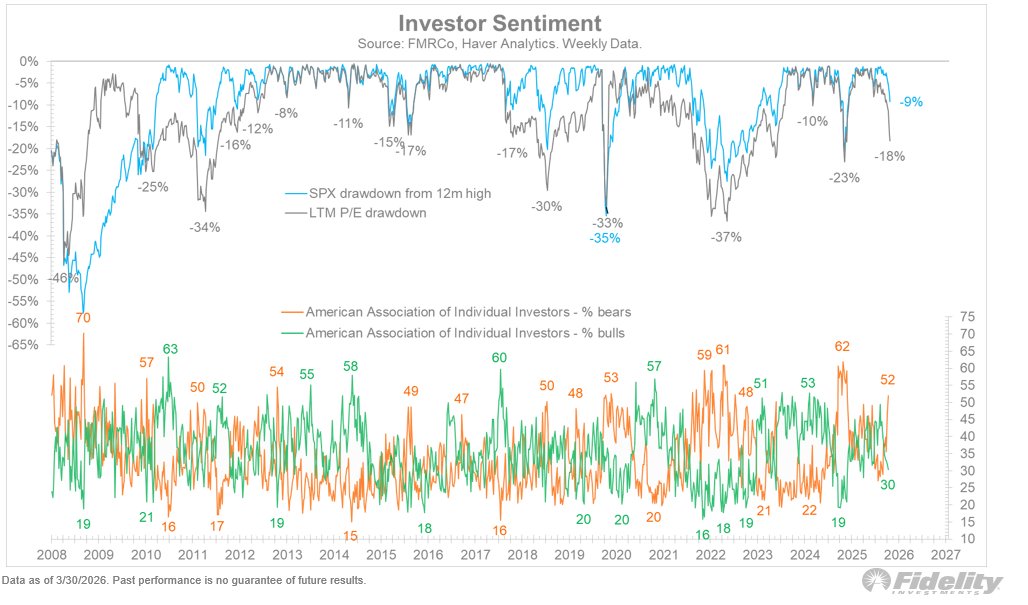
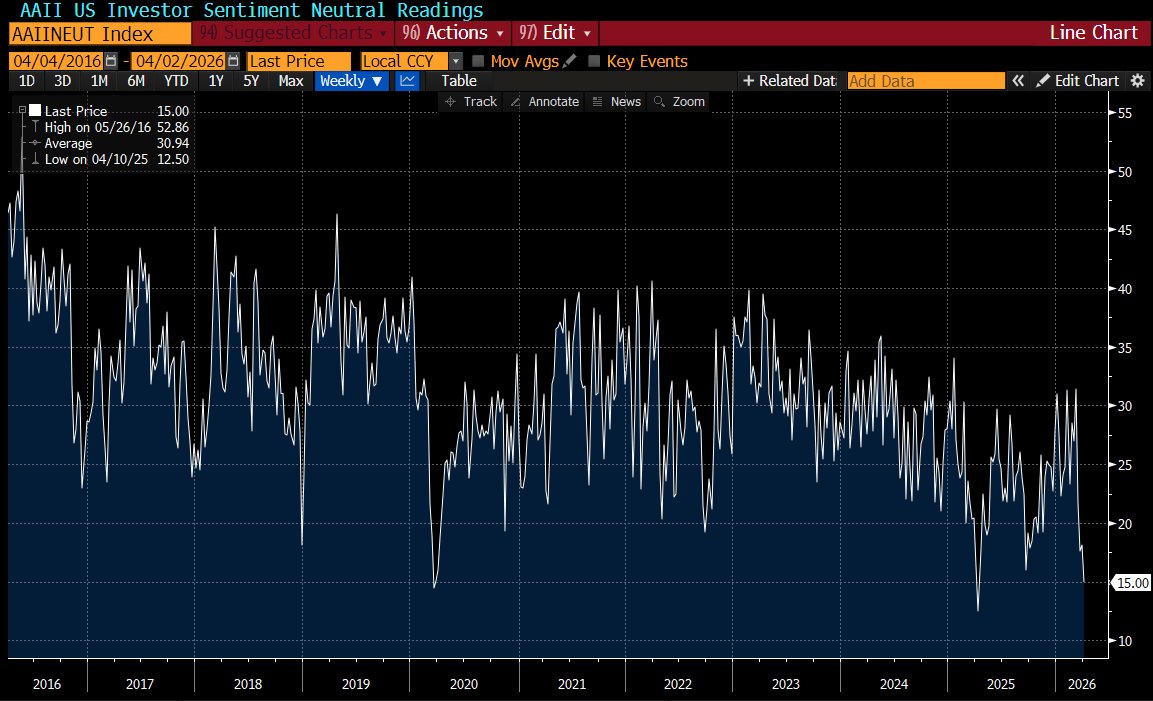
@TimmerFidelity Interestingly, nobody wants to be neutral -- that signaled contrarian buy signals during Covid and Liberation Day
Mark Hackett tweet media
English
0
0
0
224
Jurrien Timmer
Jurrien Timmer@TimmerFidelity·
Predictably, investors are getting more cautious and this is showing up in the sentiment surveys. The American Association of Individual Investors survey (AAII) tends to be volatile and shows that bears now outweigh bulls by 52 to 30. The top panel highlights that this is a valuation correction, with the P/E ratio down 18% and the price index down 9%. The Investors Intelligence survey (II), which measures sentiment among newsletter writers, tends to move more slowly and shows that bulls still outweigh bears by 49 to 22.
Jurrien Timmer tweet mediaJurrien Timmer tweet media
English
6
14
92
11.5K
Mark Hackett
Mark Hackett@Markhackettcfa·
@dailychartbook @MacroCharts CNN Fear & Greed at full blown capitulation -- hit 8 yesterday. Since 2019, when index broke below 20, next three months was up an average of 9%, with an 86% batting average.
Mark Hackett tweet media
English
0
0
1
45
Mark Hackett
Mark Hackett@Markhackettcfa·
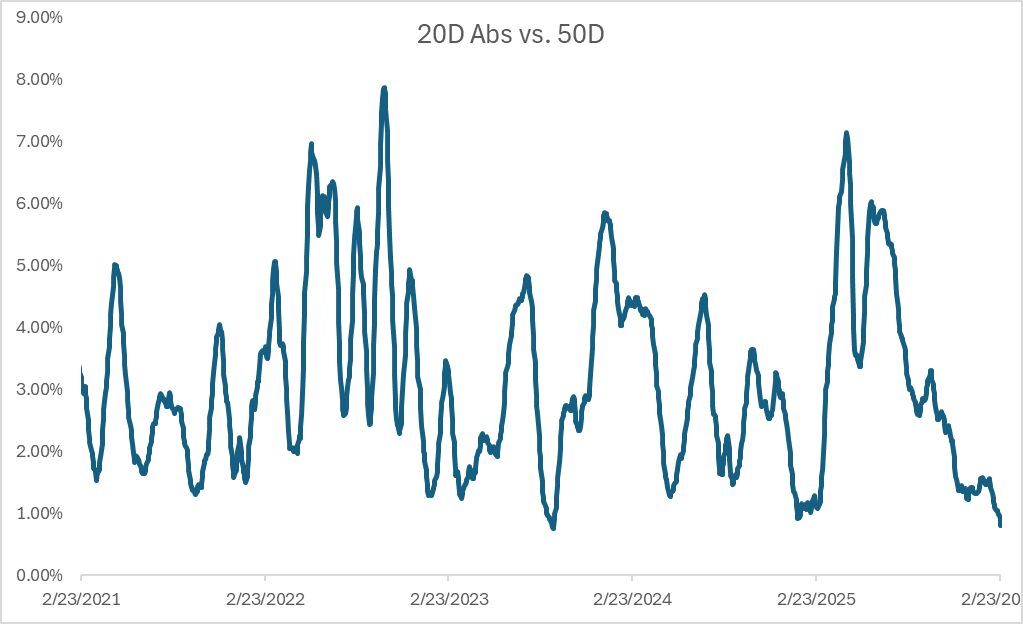
@neilksethi Here is a chart of the average gap versus the 50-day over the past month dating back five years
Mark Hackett tweet media
English
1
0
0
127
Neil Sethi
Neil Sethi@neilksethi·
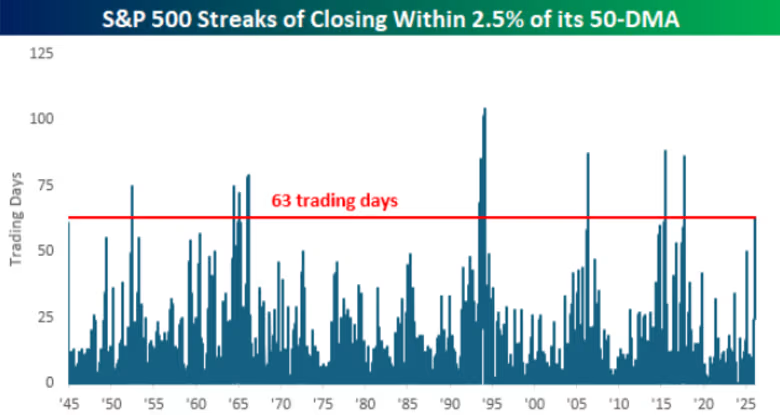
A sleeping volcano... MarketWatch: The S&P p500 hasn't closed more than 2.5% above or below its 50-day moving average over the past three months, the longest streak since August 2017, according to data compiled by Bespoke Investment Group. "Periods where the S&P 500 has been so closely anchored to its 50-DMA haven’t been all that common throughout history," the Bespoke team said in a Wednesday client note (see chart above). "Since WWII, there haven’t been many other extended periods where price was consistently so close to its 50-DMA." What makes the current streak even more unusual is that most stock sectors have been more volatile than the broader benchmark index. As of Tuesday's close, six of the S&P 500's 11 sectors closed more than 5% above their 50-day moving averages. "Like a sleeping volcano, the S&P 500 looks placid from above, but underground, the molten lava bubbles," the Bespoke analysts said.
Neil Sethi tweet media
Ryan Detrick, CMT@RyanDetrick

Over the past four months, the S&P 500 has traded in less than a 7% range. This is about as tight as things usually get, meaning a bigger move is likely over the coming months. Will it be up or down?
English
1
7
29
5.5K
Mark Hackett
Mark Hackett@Markhackettcfa·
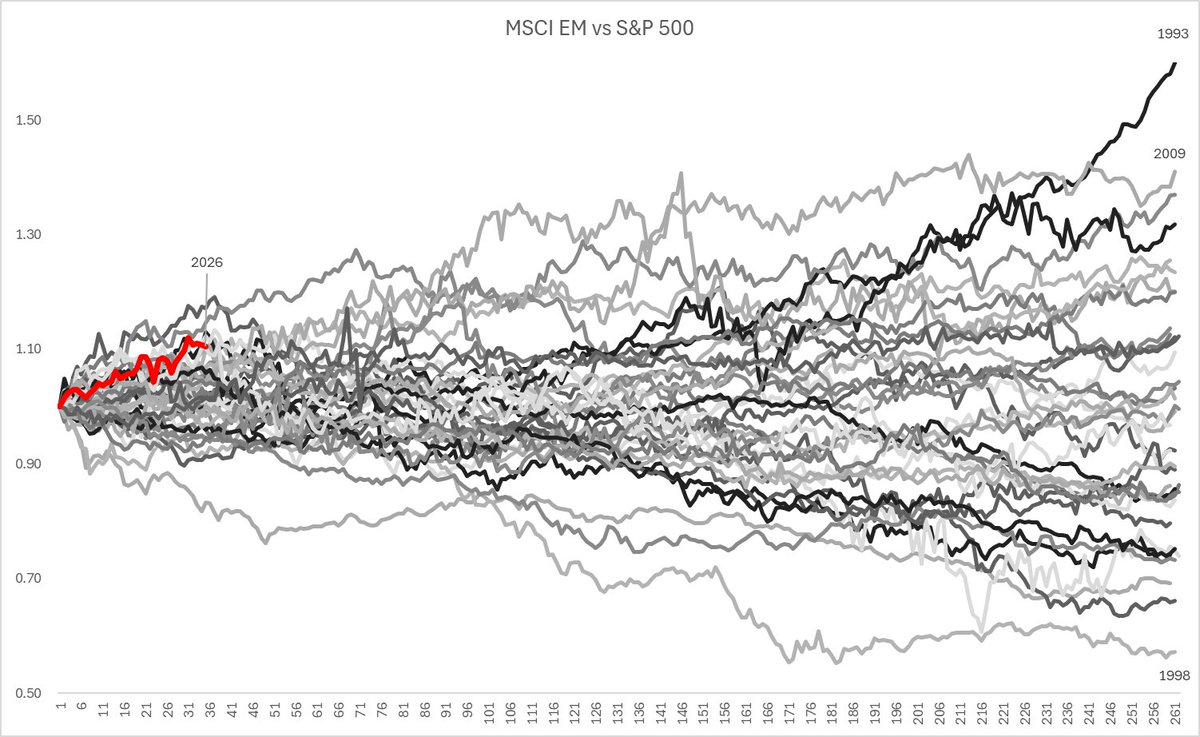
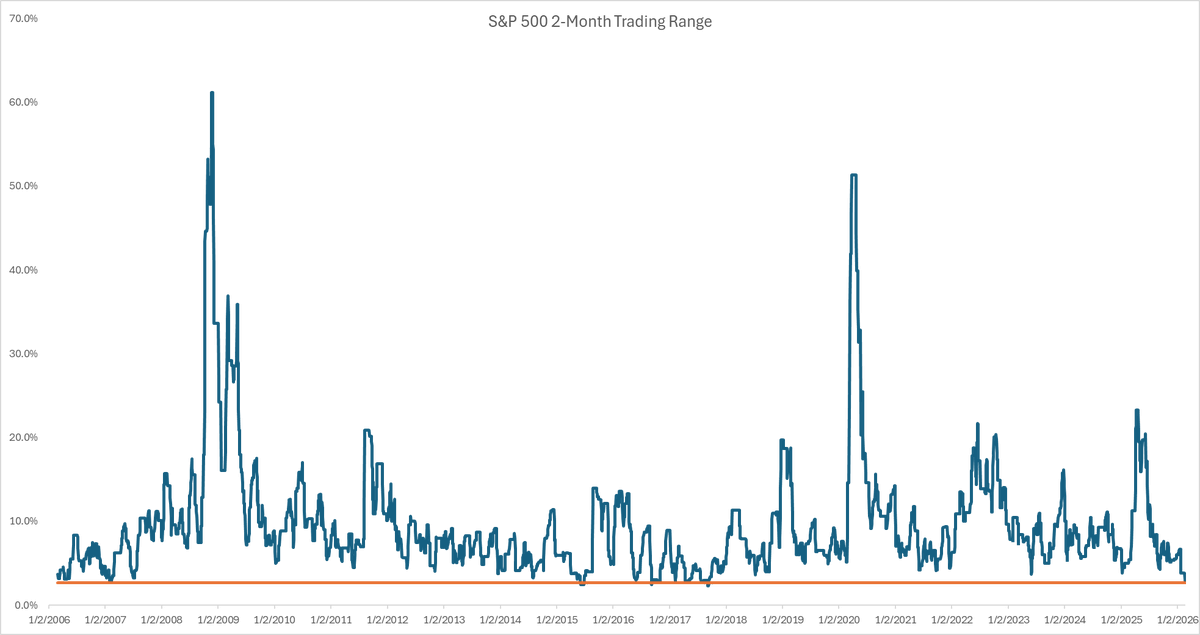
The S&P 500 is in the tightest two-month trading range since 2017, yet the average company has moved 14% this year
Mark Hackett tweet media
English
1
0
2
198
Mark Hackett
Mark Hackett@Markhackettcfa·
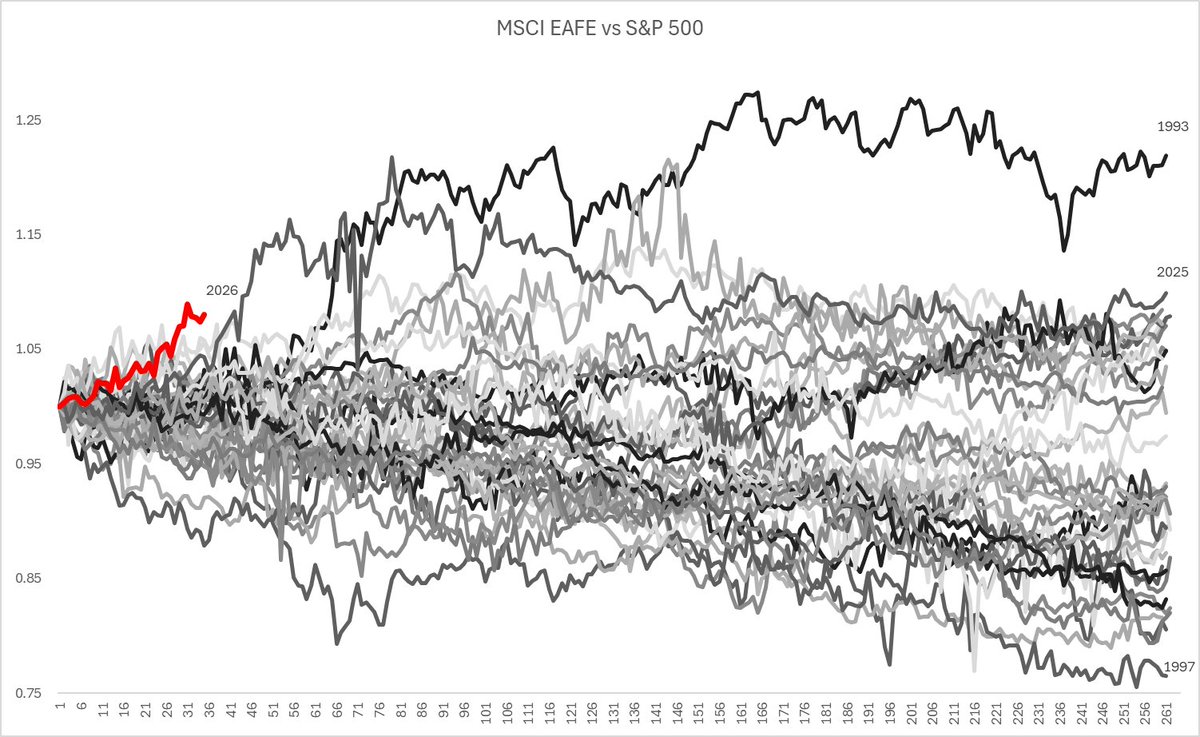
Here it is for EAFE vs S&P 500
Mark Hackett tweet media
English
1
0
0
79
Mark Hackett
Mark Hackett@Markhackettcfa·
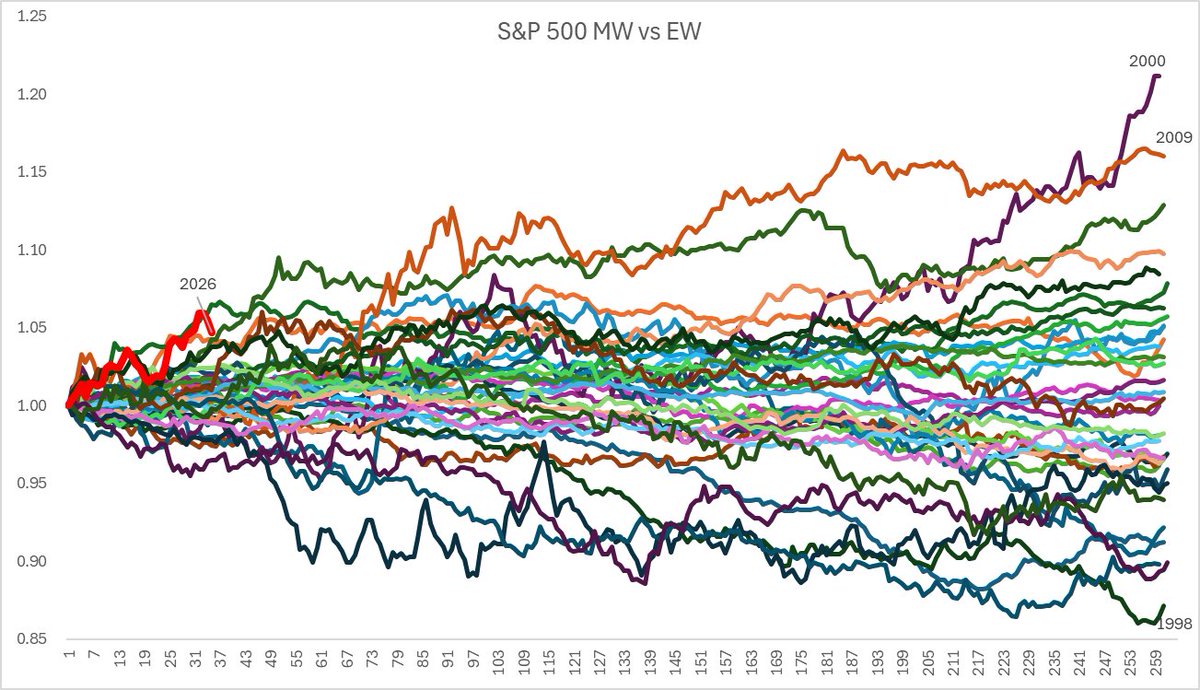
Equal weight outperformance continues, though previous positive years (2000 and 2009) were a mixed bag for the overall market
Mark Hackett tweet media
English
1
0
2
292
The Kobeissi Letter
The Kobeissi Letter@KobeissiLetter·
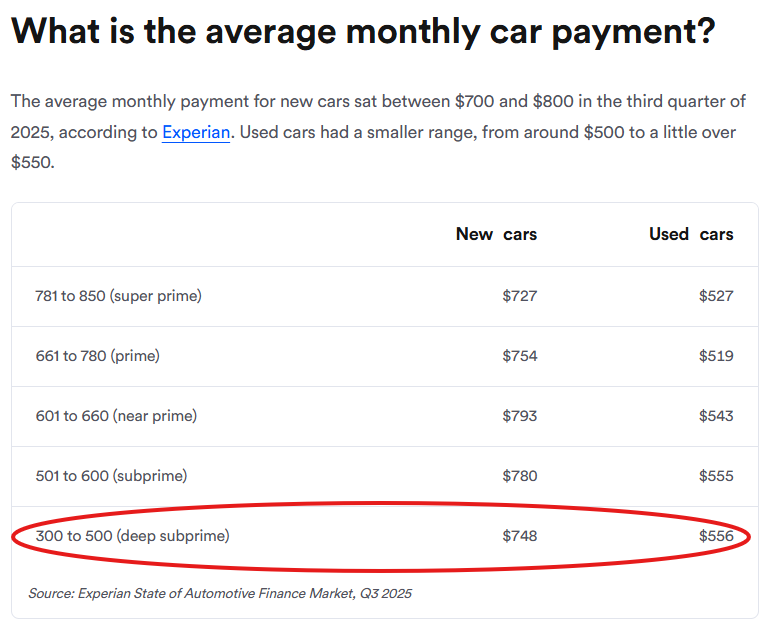
BREAKING: The 60+ day delinquency rate on US subprime auto loans is up to a record 6.9%. Serious delinquency rates have more than DOUBLED since 2021. This exceeds the 1996 peak by 0.9 percentage points. For context, the 2008 Financial Crisis high was 5.0%. Meanwhile, total auto debt is up +$312 billion over the last 5 years, to a record $1.67 trillion, driven by surging vehicle prices. Subprime financing makes up ~14%, or $234 billion, of all auto loans. Americans are falling behind on their car debt at a record pace.
The Kobeissi Letter tweet media
English
173
581
2.6K
575.6K
Mark Hackett
Mark Hackett@Markhackettcfa·
@philrosenn There are some echoes (concentration/top-heavy, lottery mentality of investors, tech outperformance vs. everything else, etc.) but the magnitude and the complexion of leadership is not comparable.
Mark Hackett tweet media
English
1
0
1
69
Phil Rosen
Phil Rosen@philrosenn·
People stopped talking about an AI bubble once they realized the technology is so good that entire companies and sectors can get wiped out overnight. This stock market is nothing like dot-com froth.
Phil Rosen tweet media
English
2
2
13
1.3K
Mark Hackett
Mark Hackett@Markhackettcfa·
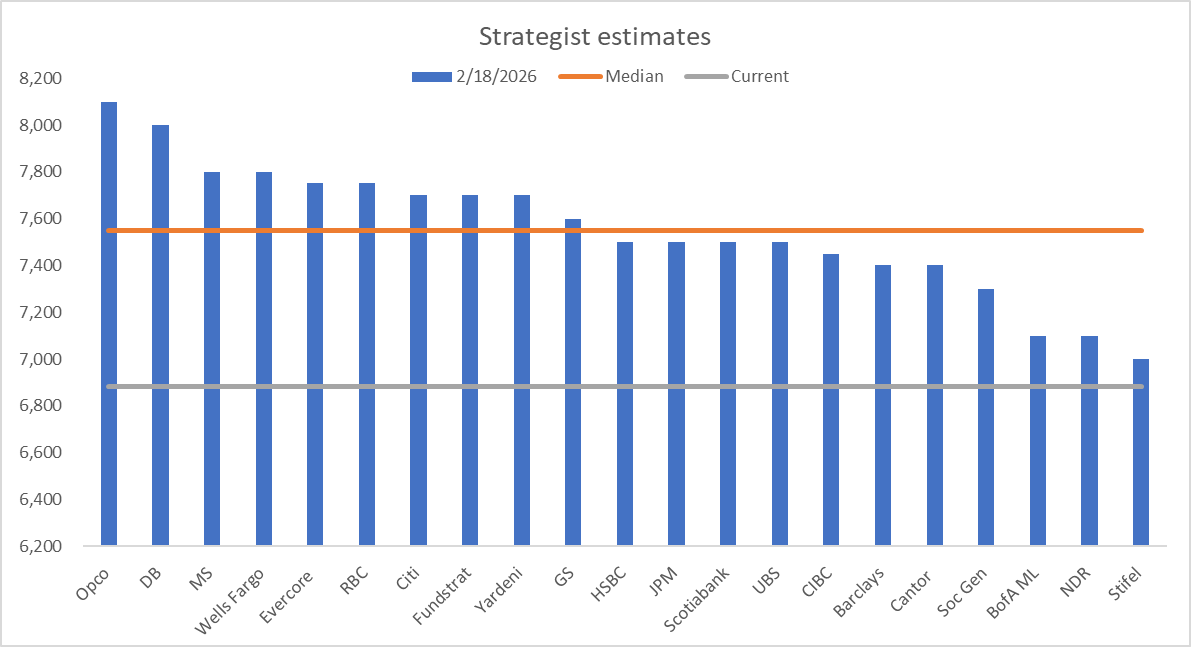
No change in strategist estimates for the S&P 500 since December -- median implies a 10% gain from here
Mark Hackett tweet media
English
0
0
2
225
Mark Hackett
Mark Hackett@Markhackettcfa·
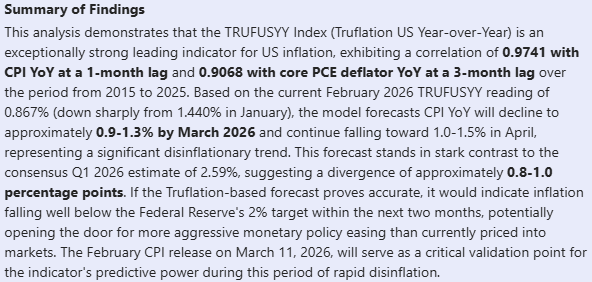
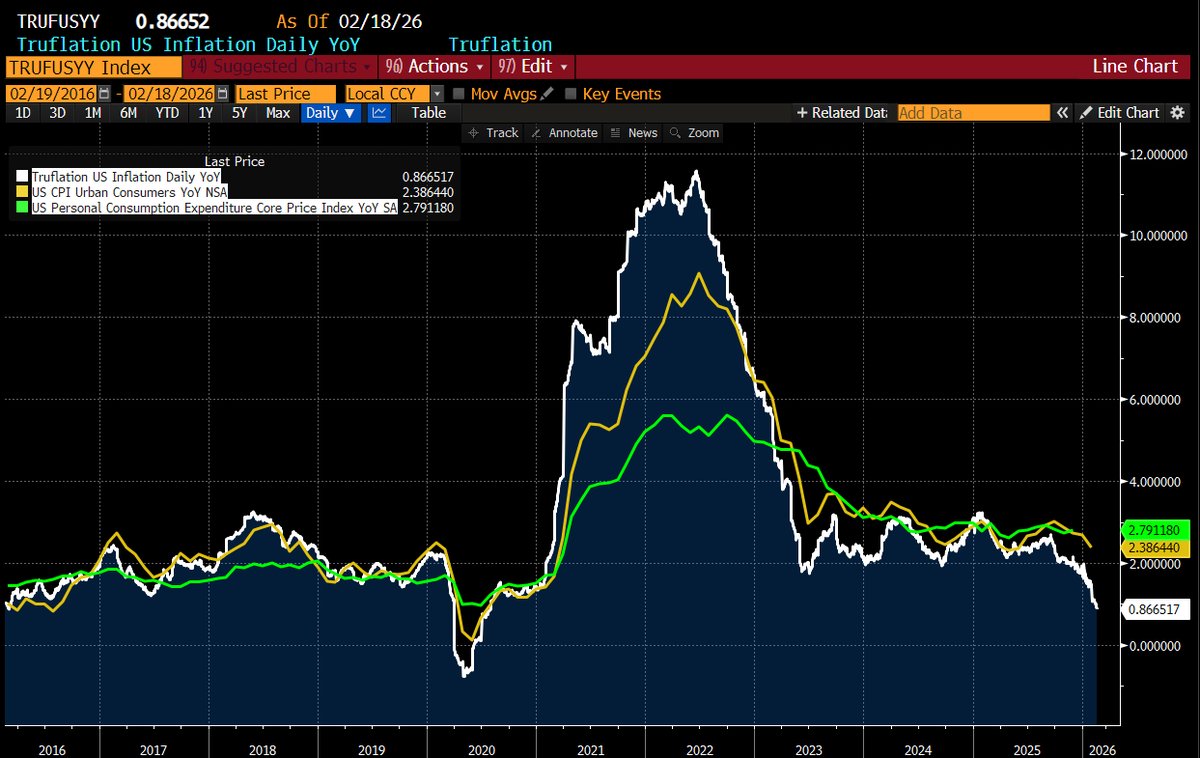
@TheBondFreak @truflation According to Bloomberg's new AI bot, there is a 97% correlation between Truflation and CPI with a 1mo lag, suggesting CPI will decline sharply in the next few months.
Mark Hackett tweet media
English
6
29
124
61.4K