SectorX
943 posts


SectorX
@SectorX_AI
Hovering Over Reality, Attracted To Glitches, Publicly Compounding Structure. 🛸 🧲 🔬 Personal: @BrianHershey
Katılım Haziran 2024
123 Takip Edilen62 Takipçiler
Sometimes I think X is listening or watching over my shoulder lol
I JUST built a system in Claude Code to flag the down periods in my last year of returns, then download the bulk all-asset flat file from massive .com.
Survivors that were up when I was down get grouped by the factors they share. 🙏 🦾
English

Most traders think diversification = adding more strategies.
Wrong.
Adding a second strategy only helps if it loses money for a different reason than your first one.
Here's how I actually measure that:

English
@RealSimpleAriel This has been my goto for Windows repair for decades.
Right click start menu, choose Terminal (Admin) and do each of these three steps...
- dism /online /cleanup-image /restorehealth
- sfc /scannow
- chkdsk c: /f /r /x
English

Is anyone a desktop expert? My computer will be perfectly fine one moment, no odd sounds, nothing that seems off. And then my screens go black and the entire desktop restarts. Does someone have an idea why this could be happening? When the computer is on, things seem to run smooth. But it randomly shuts off on its own and restarts.
English
@StockMKTNewz Were they the largest 10 years ago? survivorship bias, FOMO shaming, useless content 💩
English

This is how the largest stocks in the world have performed over the last decade
Nvidia $NVDA +16,602%🟢
Apple $AAPL +1,187%🟢
Google $GOOGL +919%🟢
Microsoft $MSFT +663%🟢
Amazon $AMZN +569%🟢
Taiwan Semi $TSM +1,536%🟢
Broadcom $AVGO +2,237%🟢
Meta Platforms $META +410%🟢
Tesla $TSLA +2,626%🟢
Eli Lilly $LLY +1,438%🟢
Micron $MU +7,705%🟢

English
@SystematicPeter I guess there are brokers still charging commission. Not these fine folks... Fidelity, Schwab, Vanguard, Robinhood, E*TRADE, Webull. But they get their money somehow ;)
English

I’ve been trading for ~30 years.
One mistake I see newer traders make over and over:
They chase speed before robustness.
Faster trading feels professional.
More trades, more signals, more feedback.
But live trading is where speed gets expensive:
commissions, spreads, slippage, bad fills, data errors, execution delays.
If fees + slippage would consume something like 1/3 of the backtest profit, the system has very little margin for normal backtest error.
A small modelling mistake, data issue, or regime change can wipe out what looked like an edge.
The chart shows a simple RSI long-dip strategy on stocks.
Not daily.
Weekly.
Backtest:
Net profit: $304,685 vs $76,502 benchmark SPY
Max DD: -18.1% vs -54.4%
Sharpe: 1.08 vs 0.42
Trades: 498
This is not exciting.
That is the point.
Slow, boring, lower-friction systems are often better candidates for a portfolio core.
Then faster sleeves can be added carefully.
Daily updates for inspiration:
crackingmarkets.com/buy-the-dip-we…

English
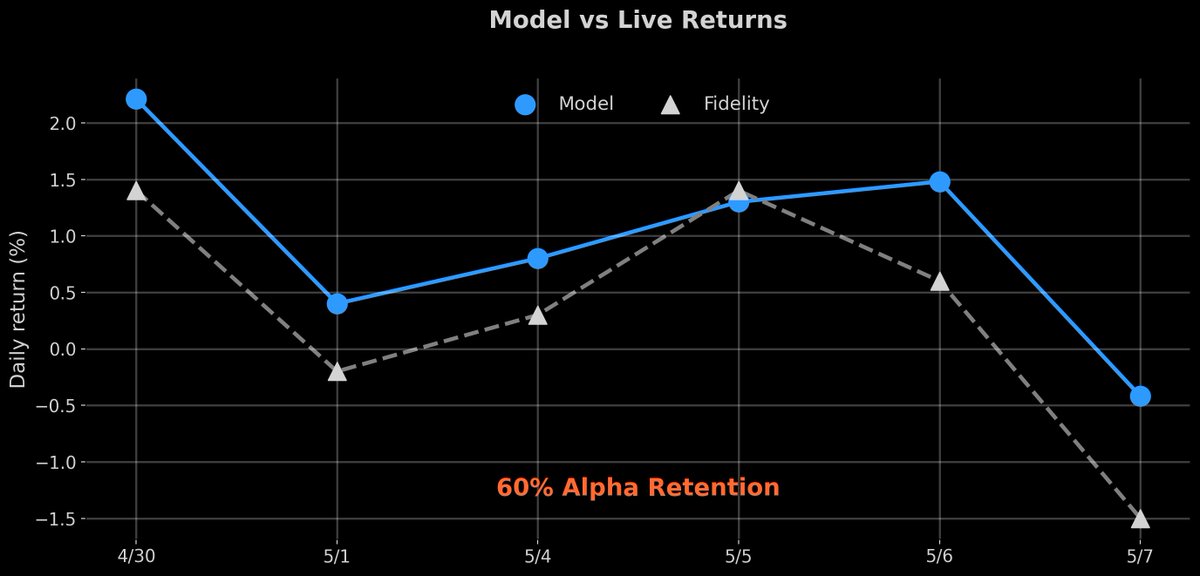

If you are not systematically measuring your sim vs live performance, you might be missing important details. Especially if you are trading portfolio based strategies.
What you really want to see in your tests is that your live actually beats your sim. That is how you know your simulations are not too optimistic.

English
@unusual_whales not so unusual whaleyyyy, visual basic can make automated trades all day long directly using the Interactive Brokers API, did that for 20 years. Nothing burger
English

BREAKING: Donald Trump executed 3,642 securities transactions during the first quarter, averaging nearly 58 trades for every U.S. trading day.
This translates to roughly nine trades every hour or about one trade every seven minutes during market hours, per YF
English

The NASDAQ is 97.5% correlated to total global liquidity.
It has almost nothing to do with earnings or how good the companies are, and everything to do with how much money the world's central banks are printing.
The small slice that liquidity doesn't explain is the NASDAQ's own adoption curve sitting on top.
This is why everyone keeps saying equities are expensive. They're using a measure that stopped working the moment we started debasing currency. A high valuation doesn't really tell you a company is doing well anymore, it tells you how much money has been printed.
This is the heart of my Everything Code framework. Once you understand that liquidity is the key driver of all asset prices, the market stops behaving like a mystery and starts running like clockwork.
English
@AmaMahogany @WatcherGuru the OAI $8 version gives me a much needed break from my $20 Claude OMG lol
English


JUST IN: Anthropic officially relaunches Claude Fable 5 worldwide.


English
@thispsyguy @WatcherGuru cause most of us never hit guardrails, guess you can't stay on the road ;)
English

@WatcherGuru I don’t know why it’s so exciting for people when they’ve explicitly stated they upped the guardrails lol
English
@Quant_Kurtis Will do! Simple mechanism, but the coherence has to be earned in asset selection or the demeaning just averages noise. That's my game.
English

@SectorX_AI this is quite interesting. keep us posted please
English
My recent relative silence on X does not mean I have been sitting on the couch watching The Other Bennet Sister and neglecting equity research.
Okay, one of those statements is true.
I've been going through a bit of a research renaissance as AI has enabled me to test and develop ideas at physics-defying speeds.
For instance I want to test a stock's path through factor space to determine (I realized this isn't a new concept) if the velocity, acceleration and curvature of very specific factors provides actional information that beats my naive factor ranks.
Spoiler alert - for these specific factors it didn't. But a failed experiment can be just as valuable as a successful one.
What's one interesting project you've been working on?

English

@SectorX_AI Is your allocation amount based on signal only or also its beta/how much it makes up of SPY?
English
🚨BILLY MAYS HERE FOR RELATIVE ROTATION GRAPHS!
Are you TIRED of comparing sectors to an index that's 30% TECH? Do your rotation signals look GREAT on screen but deliver ZERO predictive power?
THAT'S BECAUSE YOUR BENCHMARK IS BROKEN!
See, with traditional RRGs, you measure XLK against SPY, but SPY is already 1/3rd XLK! You're comparing a sector TO ITSELF and calling it "relative strength"!
That's like weighing yourself while holding the scale!
And it gets WORSE! XLU is only 2.5% of SPY while XLK is 30%. So every sector has a DIFFERENT amount of self contamination baked into its signal! Your "rotation" isn't rotation, it's just cap weight distortion sloshing around!
BUT WAIT, THERE'S MORE!
What if I told you there's a method that uses the GROUP ITSELF as the benchmark? Equal weighted. No circular reference. No sector competing against itself. Every asset measured against its REAL peer group.
And here's the BEAUTIFUL PART... once your benchmark IS the group, YOU'RE NOT LIMITED TO SECTORS ANYMORE! Crypto? Precious Metals, Energy? Commodities? Doesn't matter! Completely different asset classes, same framework, same clean signal. The method TRAVELS because it doesn't depend on some external index that only exists for one corner of the market!
And LOOK, if you INSIST on using an external benchmark for US sectors, at LEAST use RSP, the equal weighted S&P 500. SPY gives you a benchmark where tech is TWELVE TIMES more influential than utilities. RSP gives you a NEUTRAL playing field. That's not even controversial, that's just MATH!
But WHY use any external benchmark when the group measures itself PERFECTLY?
You get CLEAN signals! You get ACTUAL relative strength! You get an IC that ISN'T ZERO! And you get a framework for ANY asset class, not just the one S&P happened to build a sector taxonomy for!
STOP comparing sectors to a benchmark they're trapped inside. The benchmark should be neutral ground. SPY isn't neutral... it has favorites!
That's your RRG. You're welcome. Now CALL in the next 10 minutes for ANOTHER GREAT DEAL!
🎪📉🗑️
TrendSpider@TrendSpider
🚨 Capital doesn’t disappear. It rotates. Sector Rotation is now live. See what’s leading, what’s lagging, and where momentum is building. Follow the money.
English
@HHidden10746 steady freddy as in low volatility. My sleeves cover that range low to high on purpose.
English
@SectorX_AI By the steady freddy do you mean that you use the sectors which make up $RSP? I tried demeaning % returns each day and going long for top 60% decile bucket but it doesnt seem to beat equal weight. Maybe i am demeaning wrong, should demean price instead of rets?
English
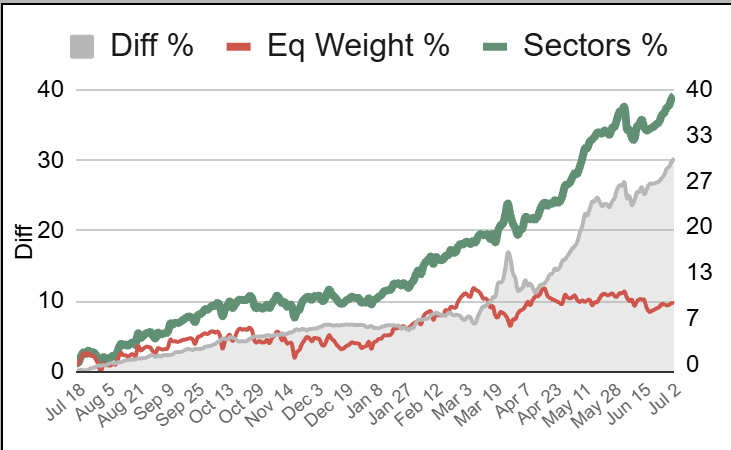
There's a standard econometrics technique that converts raw group prices into a zero sum relative signal in one step. It's called 'cross sectional demeaning'.
I admit, I built a trading system around the concept and didn't know the formal name 🤭
It removes common shocks (beta, macro tides, micro noise) by subtracting the group mean at every tick.
What's left is pure relative movement.
The trading world never adopted it because it fell between two literatures. Too academic for traders. Too financial for economists.
It doesn't sell subscriptions.
It replaces them 💥
🧩 🔑 📈
English

This p-value is awesome! The win rate is too high! Buuuuut sorry… it’s not enough🙄

English

@WatcherGuru RIP to those people who invested at 188-190. They automatically become long term investors
English
JUST IN: Elon Musk's SpaceX $SPCX falls 10.5%, erasing over $250 billion from its market cap today.

English
@quantbeckman I visit this space occasionally... sound synthesis ADSR envelopes (Attack, Decay, Sustain, Release)
English
It's not every day you see traders using time variables to exit a trade

English
@HHidden10746 I only use absolute price movement as an intraday directional signal, so if the model is ready to buy or sell in response to relative price movement I wait for the abs to confirm the direction.
English
@SectorX_AI Hey sorry i took ages to reply! Yep i think ive got something decent. How do you use absolute rets? I know you use demeaned (rel) rets to allocate, curious about the absolute rets involvement
English
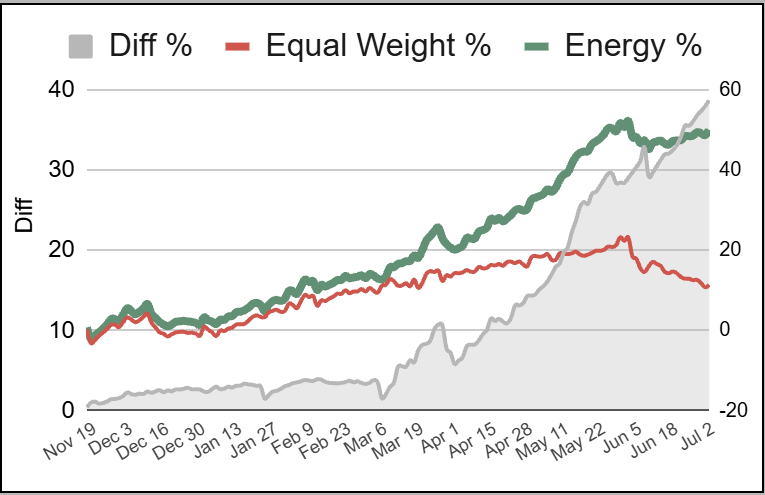
Love the story this tells, Claude and I spun this dashboard in the last couple days, 5 minute scrub replay, circle sizes are the target allocations in my account.
Gauges on the right show IC (correlation between the signal and returns that day) and allocation share of each sleeve.
$XLE dominated this week, followed by a trio of crypto miners, looks like a road trip! $LIT Lithium leading Energy.
🔭 🫧 📡
Fidelity account report:
+10% Jul-Dec
+9% Jan-Mar

English
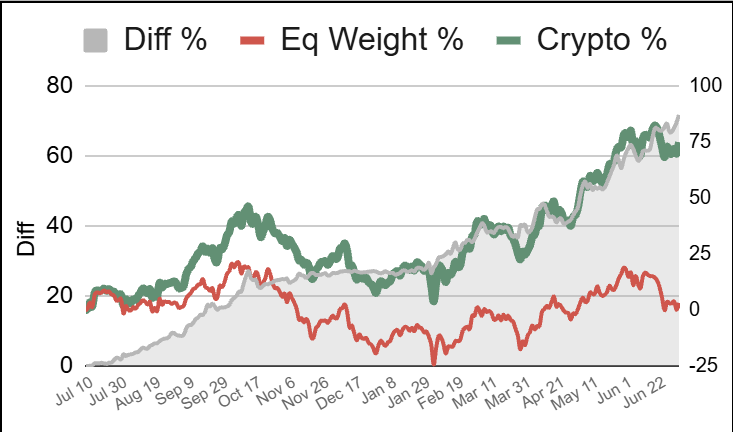
I tamed crypto, and not from smoothing it.
Stdev 4+, IC .3, sustained since November.
Textbook risk management gets it backwards... Stdev 4+ CAN be a payload!
Amplitude is what this model harvests. Stripping the oscillation to calm volatility would delete the signal that comes with it.
I let crypto swing as wild as it wants at the asset level, then it's tamed at the parent level with a SQRT volatility dampener.
The wildness stays where it generates edge (inside the sleeve) and gets metered where it'd hurt (parent allocation). Two different layers doing two different jobs. We're not taming crypto, we're routing it.
And the peer demeaning is what makes the 4+ legible in the first place. Strip the shared beta and what's left is clean competitive rotation.
The miracle isn't quieting the animal, it's finding where thrashing turns into a signal.
🌀 🔧 📡
English