Sabitlenmiş Tweet
centerlynx
60 posts


centerlynx
@centerlynx
centrelink enjoyer
Services Australia Katılım Haziran 2025
42 Takip Edilen1.1K Takipçiler
@DanielSMatthews Theyre better off just handing out UBI, this performative UBI attracts the worse kind of extractors
English

@centerlynx It is the UBI you have when you don't want to admit that 90% of your population are useless and will need UBI as they are soon to be made completely redundant by AI and robotics.
English
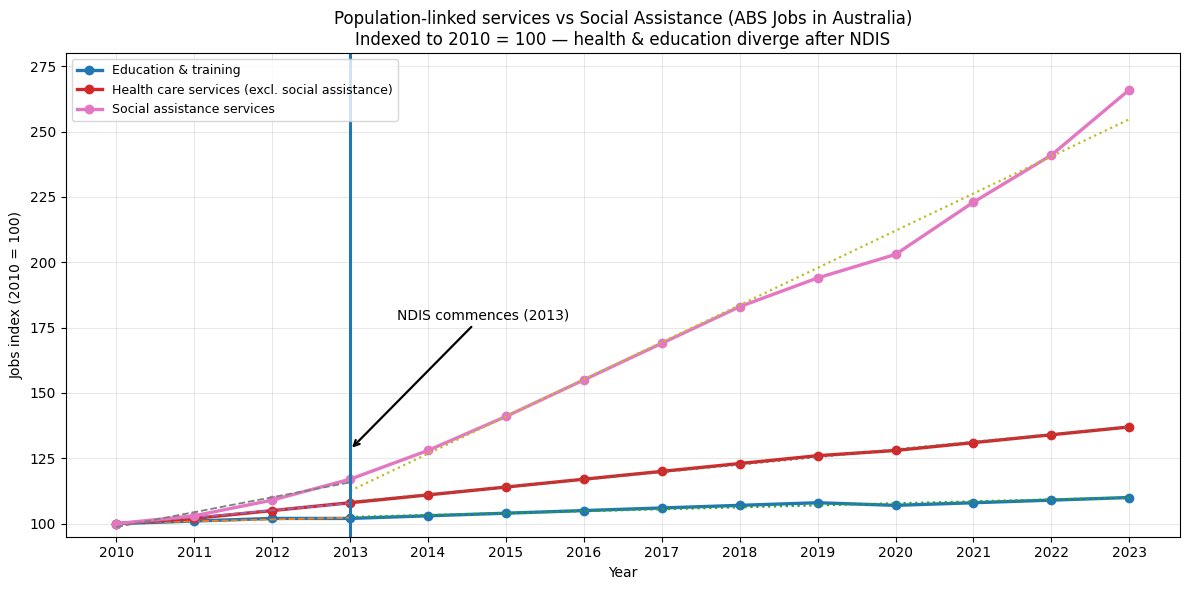
ABS data shows a sharp post-NDIS rise in “social assistance” jobs.
Growth has far outpaced other population-linked services - when funding is uncapped, what does the jobs growth really tell us?
English
@TaofiqHuq When a measure becomes a target, it ceases to be a good measure
English

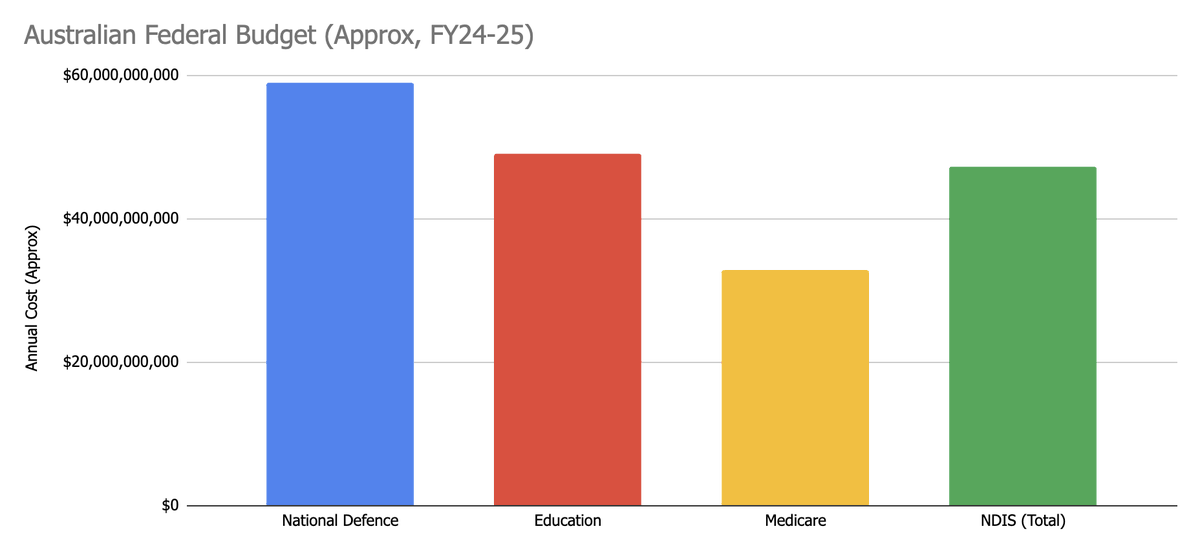
@centerlynx NDIS has grown from ~$22B (2019) to ~$40B+/yr, while admin & coordination costs have outpaced participant outcomes.
The fix isn’t cutting support. It’s tying funding to measurable gains (work, independence, health).
English
Australia has stopped funding productivity (Education) and started funding maintenance (NDIS)
The new "working class" is just an army of support coordinators and participants circulating tax dollars
We created a $40B/year incentive structure where the most stable job in the country is navigating a disability framework.
English
@longhorncapital Sure, assets vs liabilities would be more analogous
English

@LeeRespecter At this rate we will become a country of fruit pickers
English

@dowhatonemustdo I will gather more data and maybe make a post before pointing fingers
English

The more I dig into NDIS data, the harder it is to justify the system
Too many entrenched interests are profiting off taxpayers
Without structural reform, the fiscal consequences will spill into the AUD
English
centerlynx retweetledi

There are so many bad aspects of NDIS fraud
higher taxes
public debt explosion
underfunding of other services
political conflicts of interest
proliferation of organised crime
productivity decline
social contract erosion
but perhaps the worst is that it often fails the very people it’s designed to serve.
This is why there should be broad support to aggressively reform it.
Marko Matvikov@MarkoMatvikov
What we know about NDIS fraud so far: 20-30k public tip-offs ‘Losses’ estimated between $3bn - $6bn per year ‘Pay and chase’ model (payments are made first and then tip-offs trigger investigations afterwards) Widespread provider collusion, overcharging, fake invoices, and unverified identities 10-20x the number of active providers as there are aged care facilities NDIS revenue growth massively outpaces healthcare sector average Organised crime syndicates are deeply embedded NDIS businesses are highly concentrated in crime-prone areas - such as in the western suburbs of Sydney Raids across various states that target gangs defrauding NDIS link back to western Sydney
English
centerlynx retweetledi

If you thought Minnesota's Somali fraud rings were bad, wait until you hear about Australia's disability insurance program, the NDIS. It's enough to almost completely collapse our country.
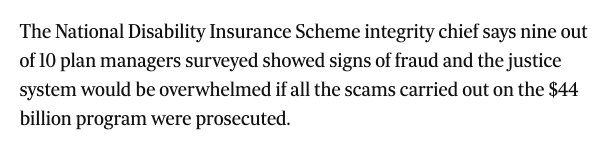
The NDIS Integrity Chief told the Australian Senate that 90% of plan managers involved in the $50 billion program showed signs of fraud and that the entire Australian justice system would collapse if they tried to prosecute it.
They receive more than 7,000 fraud tip offs a year and only prosecute about 15 people, meaning that 99.8% of allegations of fraud go unprosecuted within the NDIS.
English
At some point we need to stop burning the whole country to keep a few people warm
Marko Matvikov@MarkoMatvikov
What we know about NDIS fraud so far: 20-30k public tip-offs ‘Losses’ estimated between $3bn - $6bn per year ‘Pay and chase’ model (payments are made first and then tip-offs trigger investigations afterwards) Widespread provider collusion, overcharging, fake invoices, and unverified identities 10-20x the number of active providers as there are aged care facilities NDIS revenue growth massively outpaces healthcare sector average Organised crime syndicates are deeply embedded NDIS businesses are highly concentrated in crime-prone areas - such as in the western suburbs of Sydney Raids across various states that target gangs defrauding NDIS link back to western Sydney
English
Thanks!
I’m not trying to be political, though I recognize healthcare funding is often seen that way
There is a lot of noise in the public discourse, and my goal is not to criticize any political group, but to present important information in a clear, accessible, and easily consumable way.
English

@centerlynx is what you get when you piss off the parallax map gamers into caring about politics.
Unstoppable content.
Everyone must review.
centerlynx@centerlynx
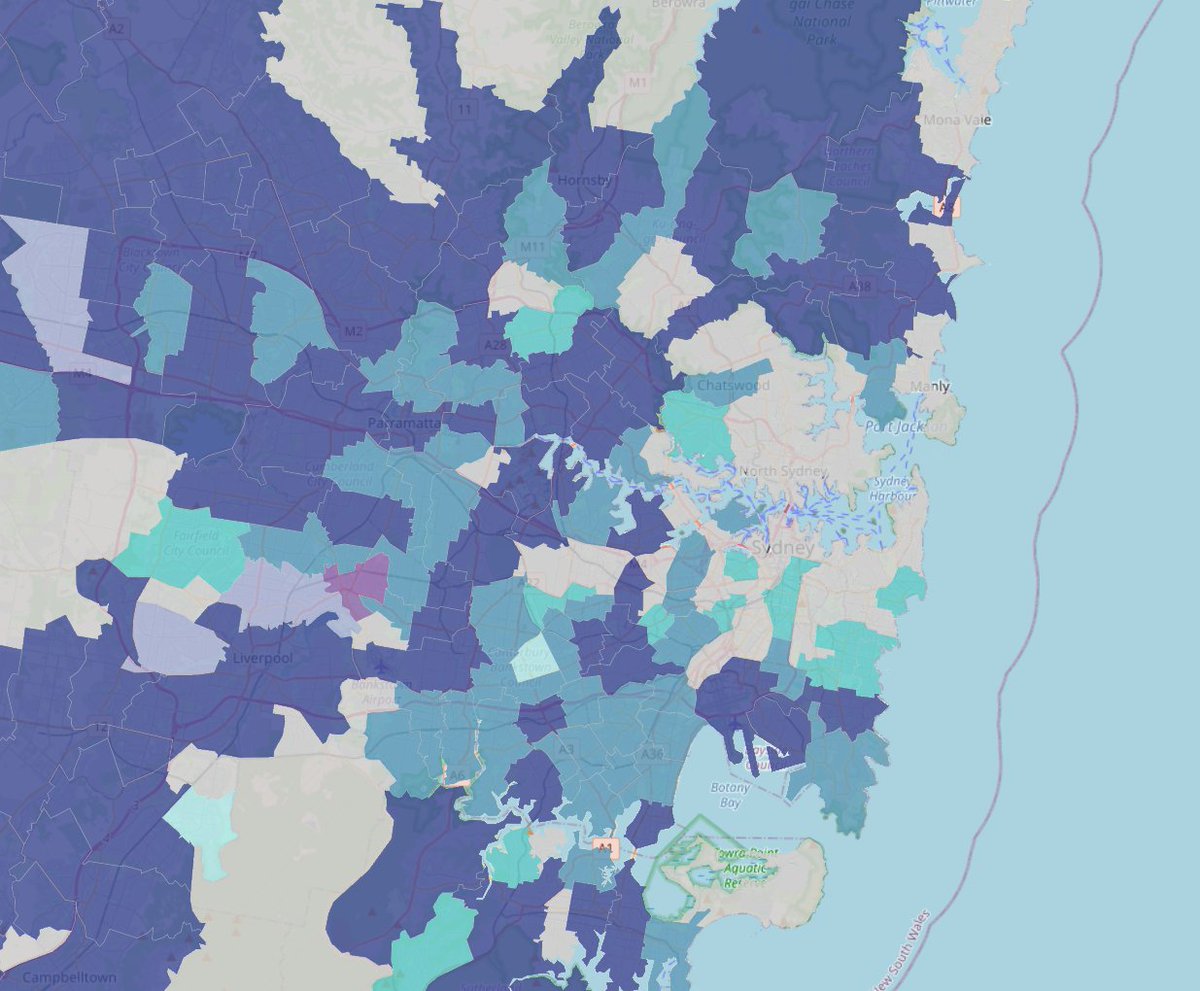
1/ We built a Bivariate Map to spot NDIS Supported Independent Living (SIL) housing anomalies. Adelaide is looks suspicious when compared to Melbourne/Sydney: high participant cost relative to median rent
English

@centerlynx You should really submit this to GovHack this year. A great use of open data that the gov asks for. Make it official.
English
The earlier maps used the official NDIS dataset, which is deliberately aggregated to protect participant anonymity
I’ve since sourced more granular official NDIS data - a more detailed NDIS-specific map is coming soon
English
@MatterOfStats For this project, that’s intentional
it was mainly meant as a quick tool to flag potential outliers so I can dig into them and see whether there’s any correlation worth exploring
English

@centerlynx 3/2
But, as I understand it, you’re finding the outliers post hoc with no a priori reason why they’re likely to be high
English
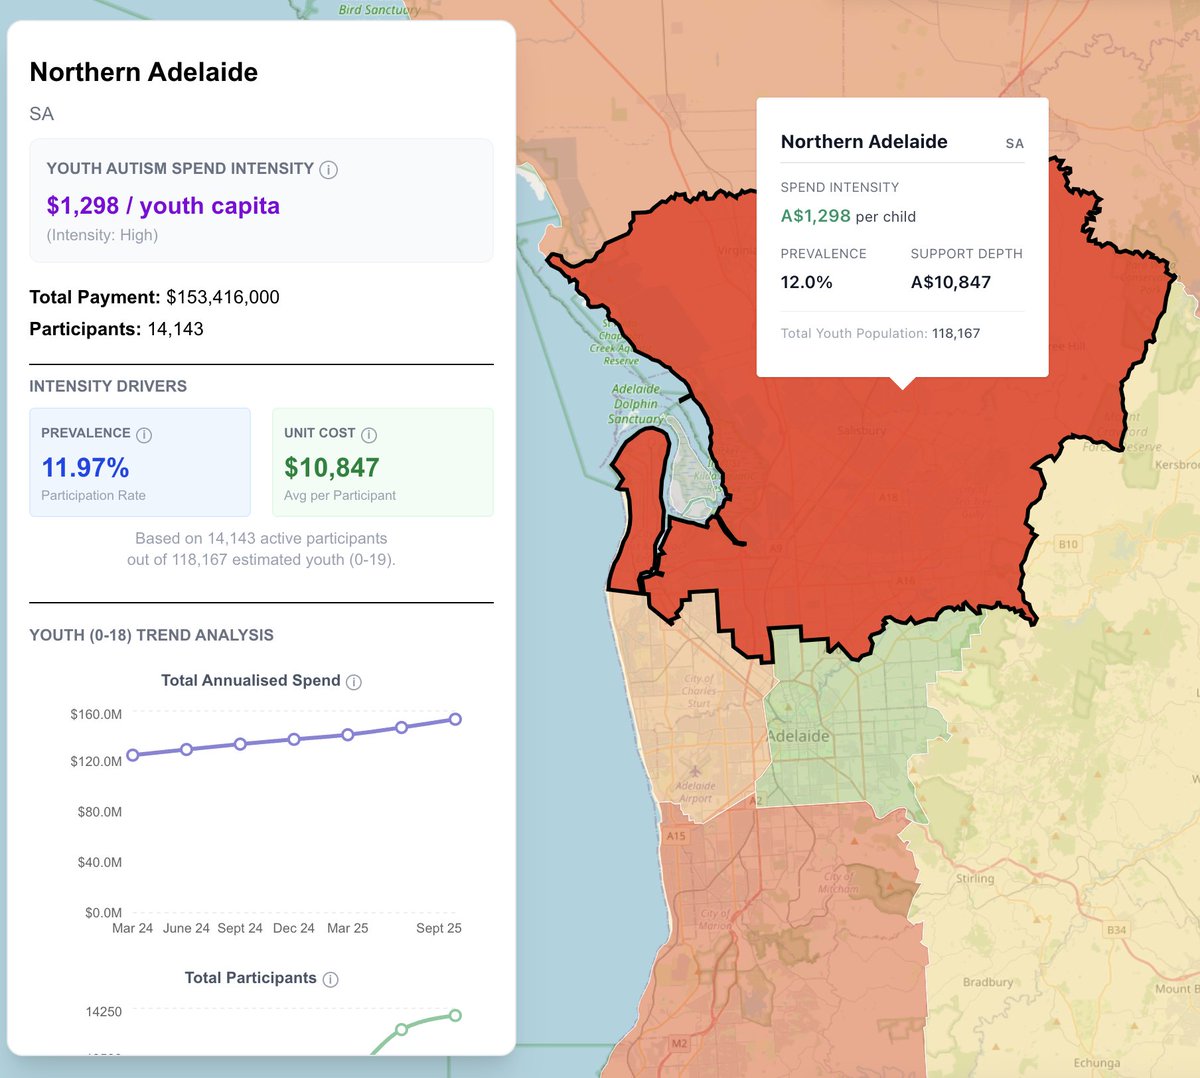
12% of Northern Adelaide youths are diagnosed with Autism, costing taxpayers >$120mil annually
When will this stop?
English
@funnycarrot For this particular dataset i scrapped it from NDIS Care Sector Demand Map
Ive uploaded it to github for convenience
github.com/centerlynx/ndi…
English

@centerlynx I looked at SIL living looks like a total scam are you webscraping the ndis provider websites?
English
1/
We built a Bivariate Map to spot NDIS Supported Independent Living (SIL) housing anomalies.
Adelaide is looks suspicious when compared to Melbourne/Sydney: high participant cost relative to median rent


English
@centerlynx Gotcha. Maybe still worth doing something to context the outliers, whatever the geographical unit you’re forced to work at (especially given your stated aim to be apolitical)?
English
@escrow1of1 Using 2021 rent data is mostly fine because identifying outliers based on ratios, the buckets are also grouped based on standard deviations
English

@centerlynx rents are from 2021, more than doubled everywhere in 2025
English
I originally set out to compare distributions between suburbs, but quickly realized that the NDIS has aggregated the data too heavily (combining multiple LGAs into single service districts). Because of that, suburb-level analysis for Youth Autism isn’t possible yet.
That said, digging deeper did surface some interesting outliers in SIL housing spending.
ndis.wtf/blog/sil-farms…
English
@centerlynx There’ll (by definition) always be outliers in any dataset. Do you ever look at the whole distribution of results to see if the outliers you find are statistically significant (ie big enough to be genuinely aberrant)?
English
@glens70 Thank you!
This piece leans alot on the data, and since you work in that field, would be curious to know your full thoughts
English
@centerlynx As a disability support worker working in a SIL house, I find these threads highly interesting.
English
@michael_timbs For this particular dataset i scrapped it from NDIS Care Sector Demand Map
Ive uploaded it to github for convenience
github.com/centerlynx/ndi…
English

@centerlynx Where are people getting the raw ndis data from?
English