Chris | ConfluenceEdge

758 posts

Chris | ConfluenceEdge banner
Chris | ConfluenceEdge

Chris | ConfluenceEdge

@confluence2edge

Swing trader. Macro, Supply & Demand, seasonality. FX & indices. Quant-tested TradingView indicators + macro dashboard - link below ↓

Katılım Haziran 2026
87 Takip Edilen58 Takipçiler
Sabitlenmiş Tweet
Chris | ConfluenceEdge
Chris | ConfluenceEdge@confluence2edge·
June PPI came in well below consensus. Headline at 5.5% YoY versus 6.2% expected, prior 6.0%. Core at 4.7% against 5.2% expected. The fine print matters though. Core PPI YoY actually ticked up from 4.6%, and ex food, energy and transport held flat at 5.1% YoY - though its monthly pace slowed from 0.8% to 0.1%. The miss is against expectations, not a broad decline in producer prices. On the Dollar Index view of the dashboard the economic component moved from +2 to +6 and the total from +3 to +7. The PPI surprise alone accounts for the swing. Context, not a signal. Expectations reset or the start of a series. How do you read it?
Chris | ConfluenceEdge tweet media
English
0
0
3
173
Chris | ConfluenceEdge
Chris | ConfluenceEdge@confluence2edge·
@Jacobtradesz Nice saying, but define what you mean by ‘trend’. You can ask 10 people and you’ll get 12 different definitions.
English
0
0
0
7
Jacob
Jacob@Jacobtradesz·
Trading with the trend instead of reversal will solve 90% of your unprofitability
English
2
0
17
668
Chris | ConfluenceEdge
Chris | ConfluenceEdge@confluence2edge·
@Mindsetfx A stated risk-reward ratio only holds if the actual win/loss distribution and tail frequency match the assumptions used to set it. Backtest tails that were ignored show up fastest in live sizing.
English
0
0
0
1
Mindset 🧠
Mindset 🧠@Mindsetfx·
RISK MANAGEMENT IN TRADING Risk per trade Position sizing Risk to rewards ratio (RRR) RISK REWAED STRATEGY Ideal of risk reward How to set risk reward and so on.. Remember; our goal is not to be right every time our goals is to protect our capital and make consistency profit
Mindset 🧠 tweet mediaMindset 🧠 tweet media
English
4
6
12
387
Chris | ConfluenceEdge
Chris | ConfluenceEdge@confluence2edge·
@0xJacobski Asking what the position does if the directional view is wrong changes sizing and holding period faster than any win-rate target. Correlation under stress usually reveals the hidden exposure first.
English
0
0
0
2
Jacob 🦊
Jacob 🦊@0xJacobski·
For years I thought getting better at trading meant getting better at predicting direction. Calling tops, calling bottoms, being right more often than the next guy. 😬 The traders I slowly started paying attention to barely talk about direction at all. They talk about what happens when they're wrong. Position size, correlation, how much a single bad call actually costs them. The idea that reframed the most for me was market-neutral thinking. Instead of betting price goes up or down, you build a position that doesn't care much either way, and try to earn from something more structural. Funding, spreads, small mispricings that don't depend on the market picking a direction. 📈 I'm not going to pretend I've mastered any of it. But just asking "what's my edge if I'm wrong about direction" quietly changed how I size and what I hold. Not financial advice, just where my head's at these days.
Jacob 🦊 tweet media
English
0
0
1
21
Chris | ConfluenceEdge
Chris | ConfluenceEdge@confluence2edge·
@ShivaVuyyuru The negative COT print supplies useful background but the order flow at 24144F looks like the actual trigger. Did that volume clear stops cleanly or show any absorption on delta?
English
1
0
0
104
Nifty Profiler
Nifty Profiler@ShivaVuyyuru·
Why can Nifty Futures fall suddenly below 24144F today? 1. LLT seller with 759 lots at 24165F 2. Abnormal selling of 5013 lots at 24144F 3. 10 BAR COT is -7398 4. Failed Range Extension 5. Yesterday's Bearish FA
Nifty Profiler tweet media
English
5
2
45
3.8K
Chris | ConfluenceEdge
Chris | ConfluenceEdge@confluence2edge·
@bepotrades Pure statistics. There are always outliers with any strategy, and they don’t say anything about the strategy itself. ICT is clearly a scam.
English
0
0
0
25
bepotrades
bepotrades@bepotrades·
Let’s be clear: ICT is a fraud - his trading performances confirm this BUT there are definitely real traders who make millions trading ICT concepts So what does this tell you? You can trade pretty much any strategy, and as long as you have data on what works and what doesn’t and you use that data in your trading - you will become profitable
English
6
0
22
1.3K
Great FX
Great FX@GOsazuwa28500·
Every profitable trader I know has one thing in common: They treat trading like a business, not a casino.
English
12
2
16
368
Chris | ConfluenceEdge
Chris | ConfluenceEdge@confluence2edge·
@tonitrades_ @milesdeutscher Market changes eat edges that looked stable in sample. AI helps rewrite rules quickly, yet only forward testing across fresh conditions shows whether the edge survives the shift.
English
0
0
0
3
toni
toni@tonitrades_·
@milesdeutscher AI tools do make building strategies way faster. But $168k in backtesting hits a wall in live trading - spreads, fees, and market changes eat the returns.
English
0
0
0
47
Miles Deutscher
Miles Deutscher@milesdeutscher·
I built a trading bot with Claude that made +$168,236. It's a complete cheat code, and the entire strategy was built using Fable 5. No dev experience required. Here's exactly how to build & backtest profitable trading strategies using AI (nfa): Step 1. Extract your strategy rules Start with any trading strategy you want to test, and drop this prompt into Fable 5: "Take the classic [strategy name] and turn it into a fully objective rule set on the [insert timeframe]. Give me: exact entry rule, exact exit rule, stop logic, and position sizing. No discretion - every rule must be computable." This could be an RSI strategy, EMA strategy, etc. The goal here is to get a clean set of rules you can actually backtest. Step 2. Convert to Pine Script Once you have your rules, paste this follow-up: "Now write this as TradingView Pine Script v6 strategy code. Include a 0.1% commission per side, and code ready to paste into the Pine Editor. Copy the entire code block it gives you. Step 3. Import into TradingView Open TradingView → Pine Editor → New Script. Paste the code and click Add to Chart. You'll instantly see every historical entry, exit, win, loss, and drawdown. If you hit errors, screenshot them, paste back into Fable, ask for a fix. Step 4. Refine the strategy This is where the real alpha lives. Download the CSV file from your TradingView backtest results. Import it back into Fable and prompt: "Analyse this trade history and tell me exactly how to improve this strategy." Fable will identify patterns in your losing trades, suggest rule adjustments, and help you rebuild a stronger version. Step 5. Automate it Connect Claude Code to your exchange via its MCP server. Generate an API key from your exchange and hand it to your agent. Now the loop closes: Fable backtests the strategy, you validate the results, and the system watches the market and executes automatically whenever your conditions are met. Don't want full automation? You can just set it up to flag you whenever a trade opportunity meets your parameters.
Miles Deutscher tweet media
English
94
59
426
68.2K
Chris | ConfluenceEdge
Chris | ConfluenceEdge@confluence2edge·
@kieran__duff Average spread assumptions miss the spike that occurs exactly when your rule triggers. That conditional cost often turns a marginal edge negative before any other factor.
English
0
0
0
6
Kieran Duff
Kieran Duff@kieran__duff·
Your fill quality depends on conditions your backtest can't always see: whether the broker is a dealing desk taking the other side, or routing to a liquidity pool. On one, spreads can widen exactly when your strategy fires; on the other, you're fighting for queue priority against faster flow. Always run the conditions live before adding size to any portfolio or strategy.
English
0
0
5
659
Chris | ConfluenceEdge
Chris | ConfluenceEdge@confluence2edge·
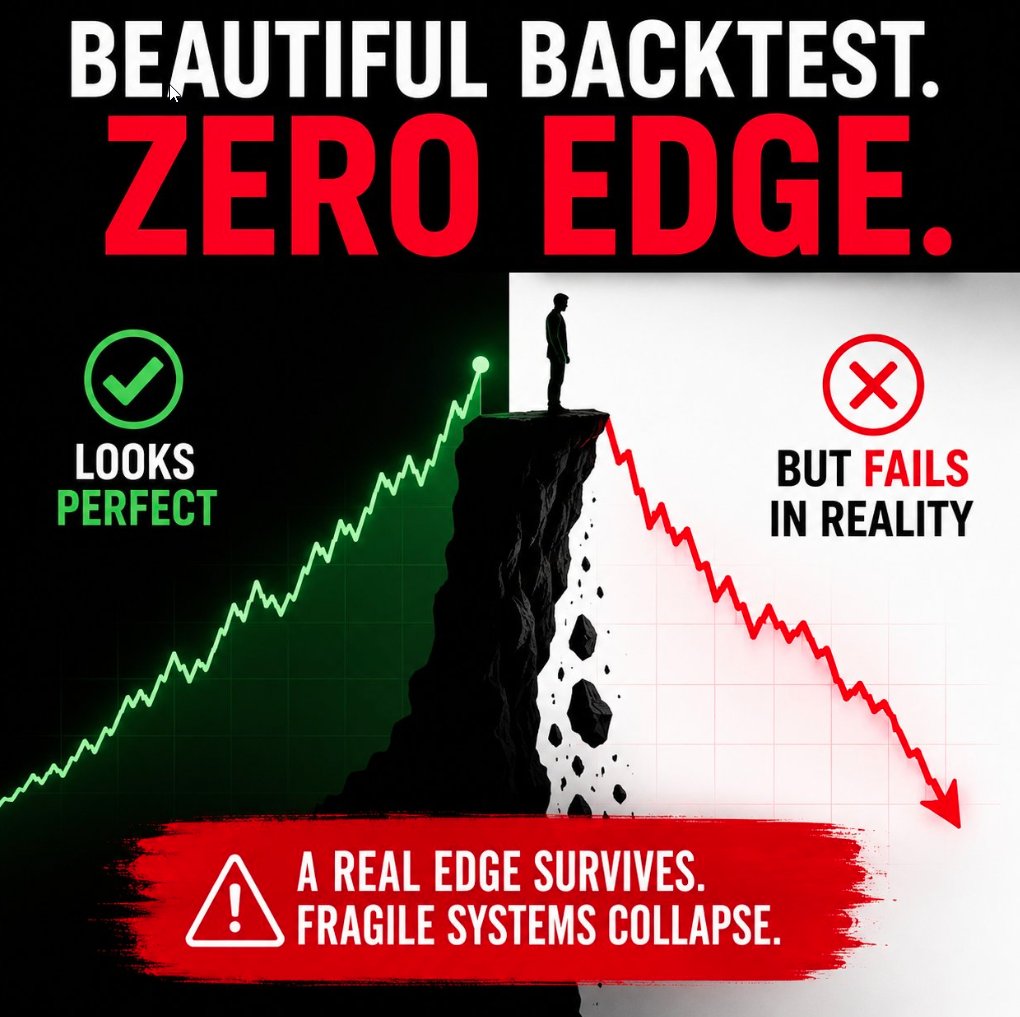
@QuantifiedStrat A strategy with edge in one volatility regime often dies in the next. Split backtests by high-vol versus low-vol periods and trend versus range before treating any equity curve as reliable.
English
0
0
0
5
QuantifiedStrategies.com
QuantifiedStrategies.com@QuantifiedStrat·
How To Know If A Strategy Actually Has An Edge The biggest mistake traders make is believing a beautiful backtest automatically means a profitable strategy. It doesn't. A real edge should keep working when markets change. It should survive bull markets, bear markets, high volatility, and quiet periods. If a strategy only works during one specific environment, it may be little more than luck. Another good test is to make small changes to the rules. Shift an indicator setting slightly. Adjust the exit by a small amount. Change the lookback period. If performance completely falls apart, the strategy is probably fragile rather than robust. Simple strategies also deserve more trust than overly complex ones. Every extra rule increases the risk of curve fitting, where a system is designed to fit the past instead of the future. Finally, look for enough trades and a logical reason why the strategy should work. An edge built on market behavior, combined with a large sample of trades and realistic expectations, is far more valuable than a backtest with spectacular returns. The goal is not to find the perfect strategy. The goal is to find one that is likely to keep working when real money is on the line.
QuantifiedStrategies.com tweet media
English
0
0
1
337
𝐙𝖎𝖑𝖑𝖆👨🏾‍💻 • 𝕾⚡•
Trav, look at it from this angle You're trading from am angle of Psychological Abundance Another person is trading for Survival The FEAR at which the second person trades from would in no way compare to how easily you'd win trades Let's not forget trading is 90% a psychological game after all Fear And Greed Are both psychological
English
3
0
3
99
Chris | ConfluenceEdge
Chris | ConfluenceEdge@confluence2edge·
@kasegeno19104 Liquidity sweeps frequently happen at or near supply and demand zones. The sweep itself matters less than whether higher-timeframe imbalances stay unfilled afterward.
English
0
0
1
12
MarketPredator
MarketPredator@kasegeno19104·
🚨 MARKET PSYCHOLOGY SECRETS✍️ ✔ Price moves because LIQUIDITY must be collected ✔ Smart Money hunts STOP‑LOSS clusters before real direction ✔ Breakouts work ONLY after a clean liquidity sweep ✔ Trend shifts begin with displacement + strong momentum candle
MarketPredator tweet media
English
1
1
9
226
Chris | ConfluenceEdge
Chris | ConfluenceEdge@confluence2edge·
I would only partially agree with that. It’s really just statistics and distribution. No matter how stupid a strategy is, there are always profitable traders, and no matter how good one is, there are always unprofitable traders. The outliers always do something differently, they’ve adjusted something, left something out, etc. Or it’s simply due to too small a sample size or just random chance.
English
0
0
2
433
tfk
tfk@timeframeking·
Let’s be clear: ICT is a fraud - his trading performances confirm this BUT there are definitely real traders who make millions trading ICT concepts So what does this tell you? You can trade pretty much any strategy, and as long as you have data on what works and what doesn’t and you use that data in your trading - you will become profitable
English
21
2
81
7.4K
Chris | ConfluenceEdge
Chris | ConfluenceEdge@confluence2edge·
@tradericch To be precise, they win because they have a statistical edge, exactly what most traders are missing.
English
0
0
0
17
TradeRicch
TradeRicch@tradericch·
The reason casinos always win isn’t because they never lose. It’s because they don’t change the rules after every loss.
English
2
2
16
1.2K
Mr~ICT✍️
Mr~ICT✍️@Mr1CT·
Do you have a trading partner or you trade alone ??
English
35
2
49
5.2K
Ceysu
Ceysu@shairnn·
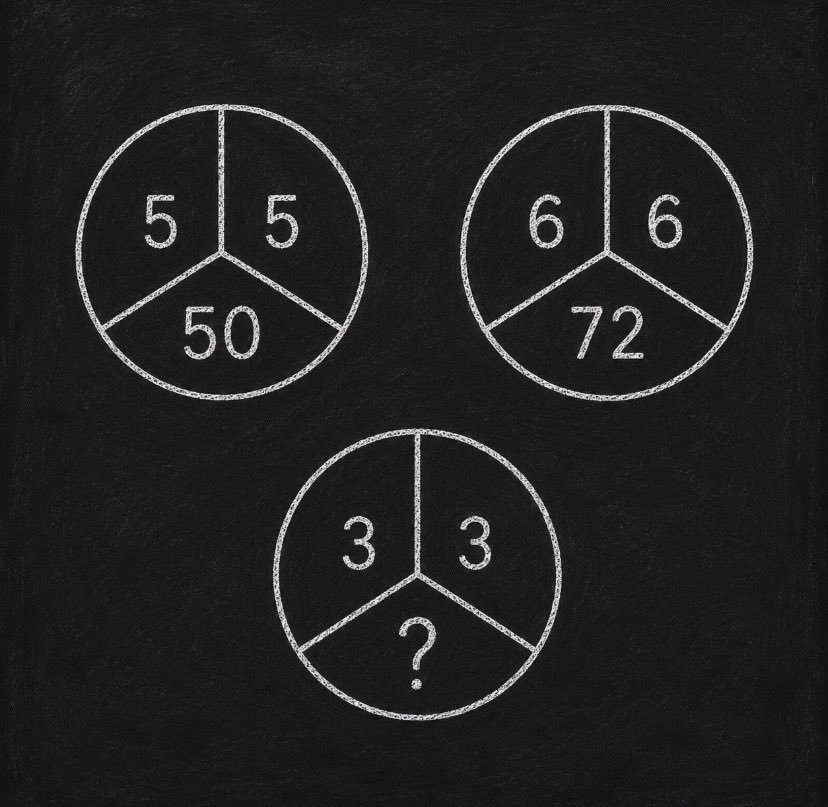
bunu çözersen, matematik bilgin ortalamanın üstündedir. çözebilir misin?
Ceysu tweet media
Türkçe
54.6K
448
5.7K
3.2M
kuno
kuno@kunoo·
$1,000 to 10 people who predict the correct score. England vs Argentina. Winners announced in 12 hours.
kuno tweet media
English
2.5K
271
1.4K
192.8K
Soheil PKO
Soheil PKO@soheilpko·
@tradericch I'd say psychology and risk management. A decent strategy can survive with both. A great strategy won't survive without them.
English
2
1
2
87
TradeRicch
TradeRicch@tradericch·
Is psychology really the biggest problem in trading?
English
25
2
26
3K
Chris | ConfluenceEdge
Chris | ConfluenceEdge@confluence2edge·
@hb_stocks Naming the pattern builds awareness. Durable change comes from the review loop that catches the exact rule bend and logs the cost in expectancy.
English
0
0
1
5
HaseebBadar_Stocks
HaseebBadar_Stocks@hb_stocks·
Stage 6 — Fix the operator, not just the system Most blowups are psychology, not analysis. Primary: Mark Douglas, Trading in the Zone Alternative: Minervini, Mindset Secrets for Winning : amzn.in/d/05KZ5EYD or Jack Schwager's Market Wizards interviews: Trading in the Zone: amzn.in/d/0a7FTDJM
English
2
0
0
651
HaseebBadar_Stocks
HaseebBadar_Stocks@hb_stocks·
The knowledge to become a swing trader is all out there for free. Buried across 40 books, 100 blogs, and a thousand contradicting threads. Most people drown in it and quit inside a year. The one ordered path through the noise:
English
1
23
60
9.3K
Chris | ConfluenceEdge
Chris | ConfluenceEdge@confluence2edge·
@RHerman @tradingview @LumiTraders That sounds good, I'm excited and will definitely give it a test at some point. I also have quite a few things in my own quiver and I'm always interested in other models and ideas.
English
0
0
1
31
Herman Trading
Herman Trading@RHerman·
🚨 FREE INDICATOR ALERT🚨 Dropping TOMORROW around noon ET. HTF LIQUIDITY MAP [HERMAN] @tradingview has plenty of liquidity indicators-but almost none display higher-timeframe liquidity in a way that is genuinely clean, clear and professional. So I’m building one myself. The indicator automatically maps important HTF buy-side and sell-side liquidity levels directly onto your chart, showing: • Where liquidity is still resting • Which timeframe created each level • Which levels have already been swept • Where price may be drawn next No clutter. No messy charts. No manual marking. Just a clean multi-timeframe liquidity map built for real trading. And I’m releasing it 100% FREE for the community. 📅 Thursday, 16 July ⏰ around noon Eastern Time Which HTF liquidity levels do you watch most: 15m, 1H, 4H or Daily? #TradingView #FuturesTrading
Herman Trading tweet mediaHerman Trading tweet mediaHerman Trading tweet media
English
11
11
117
5.3K
Chris | ConfluenceEdge
Chris | ConfluenceEdge@confluence2edge·
@torvale1953 Energy relief in the prints can reverse fast. S&D on crude already shows the rebound testing whether demand destruction is durable or just delayed.
English
0
0
1
9
LOUIS WOOLF
LOUIS WOOLF@torvale1953·
We are half-way through an economic data heavy week and it has been good news so far for inflation readings. Core CPI beat expectations on Tuesday, headline CPI month-over-month was down -0.4%, an improvement from May’s figures which were up 0.5%. Markets responded positively, with E-mini S&P 500 Index Futures rising 0.45% on Tuesday. The index for energy fell -5.7% in June, compared to rising 3.9% in May. Energy was the largest contributor to the monthly, all items decrease and offset increases across other indexes including shelter and food. The Producer Price Index (PPI) was expected to remain steady in June compared to rising 1.1% for the prior month. Final demand numbers show PPI fell -0.3% in June compared to increasing of 0.6% percent in May.  On an annual basis, the index indicated a 5.5% inflation rate. Excluding food and energy, core PPI rose 0.2%, against the outlook for a 0.3% increase. As with consumer prices, the index benefited from easing energy costs, particularly as oil fell due to receding tensions between the U.S. and Iran. Light Sweet Crude Oil Futures for August (/CLQ26) are higher 0.48% to 79.74 (As of 8:45 AM ET), Wednesday morning after the release of the newest PPI numbers. The E-mini S&P 500 Index Futures for the month of September (/ESU26) moved higher 0.25% to 7610.50 on the news. Despite the win, with the inflation readings, market participants are listening to comments from members of the fed for hints to future interest rate policy decisions. Currently the CME Fed Watch tool shows a 90.9% probability of the target rate holding firm at 350-375 bps for the July 29, Federal Open Market Committee meeting. Looking out to September, however, the story changes and the odds are almost 50/50 for a rate increase. The probability of a 25 bps increase in September is 47%, and something to monitor during the coming weeks. One of the main drivers behind lower inflation number for June was the ceasefire and the opening of the Straight of Hormuz. Over the month of June, August Crude oil Futures were lower -23.12%. The month of July started with Crude Oil below $70 (68.98 as of open July 1) and now has moved higher 16.4% and pushing up against $80. Over the past couple of weeks, the ceasefire and peace talks have stalled. This morning, the U.S. launched air strikes on Iran. President Donald Trump had warned that strikes would intensify if Tehran does not cooperate in peace talks and added that U.S. forces would target key infrastructure next without a diplomatic breakthrough. As market participants consider the impact of recent geopolitical escalations against the new data points. Investors will be asking the following questions: Will escalations with Iran, reverse the positive inflation reading we saw in June? Do these new data points warrant an increase in rates as members of the fed have been debating the next move? Kevin Warsh will speak today at 10:00 AM ET.  DATA FROM JP MORGAN & SCHWAB
English
1
0
1
98