The filter is revolting!
Jessica Hadwin@jessicahadwin
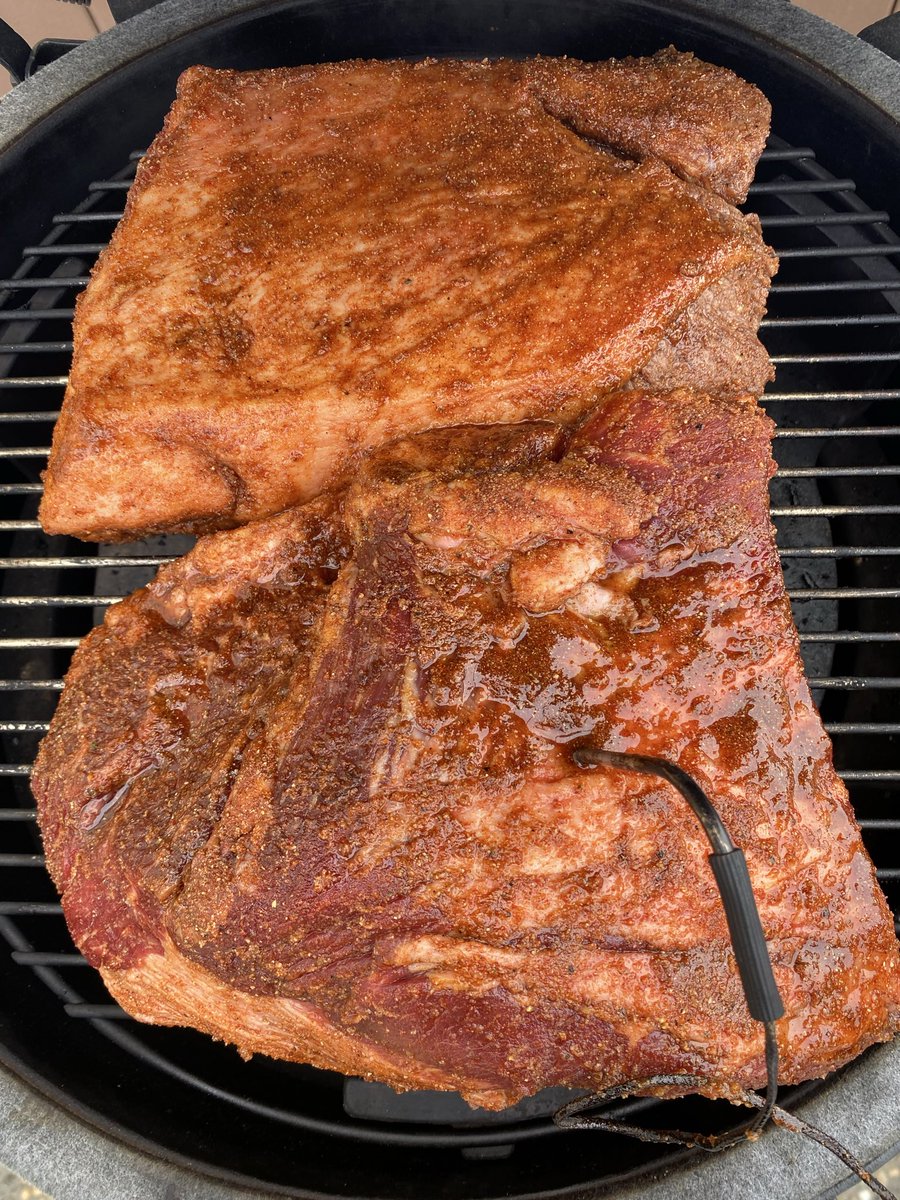
Just another lovey date night in the desert #nofilter
English
CDR
7.3K posts

@seeriley
Husband, Dad, Sask born, Energy Enthusiast, Flames, Mets, Cowboys & Go Riders Views are my own, worth exactly what you paid for them😎
Just another lovey date night in the desert #nofilter

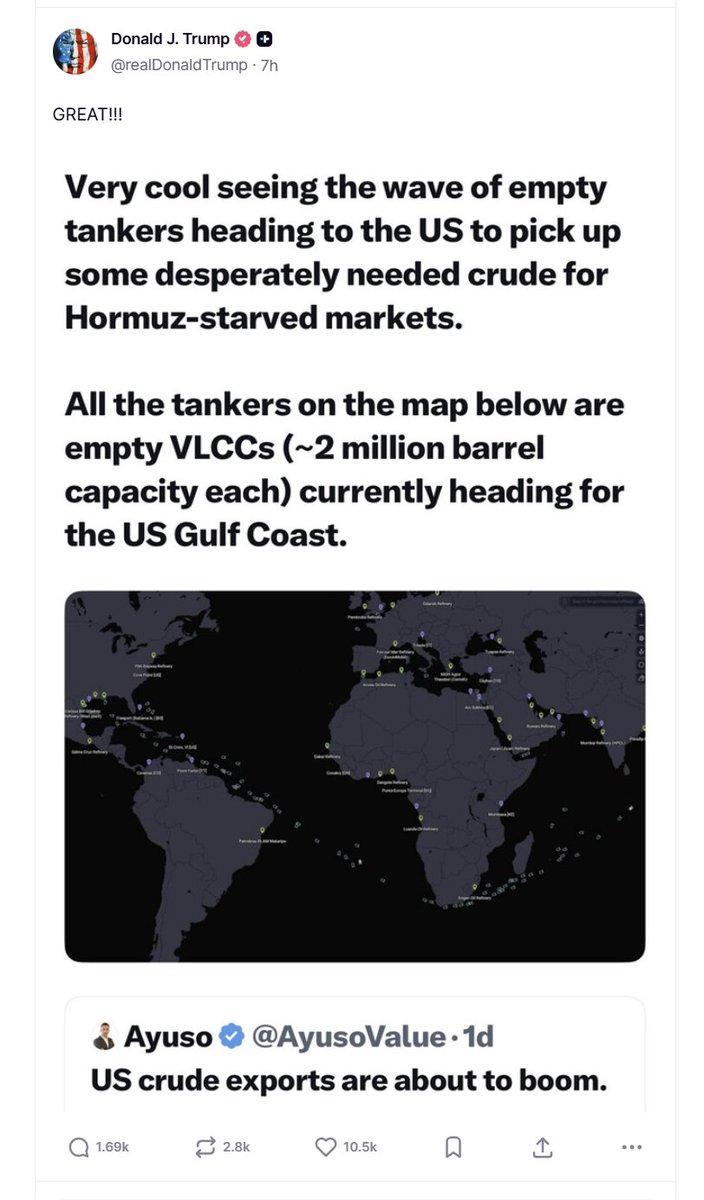
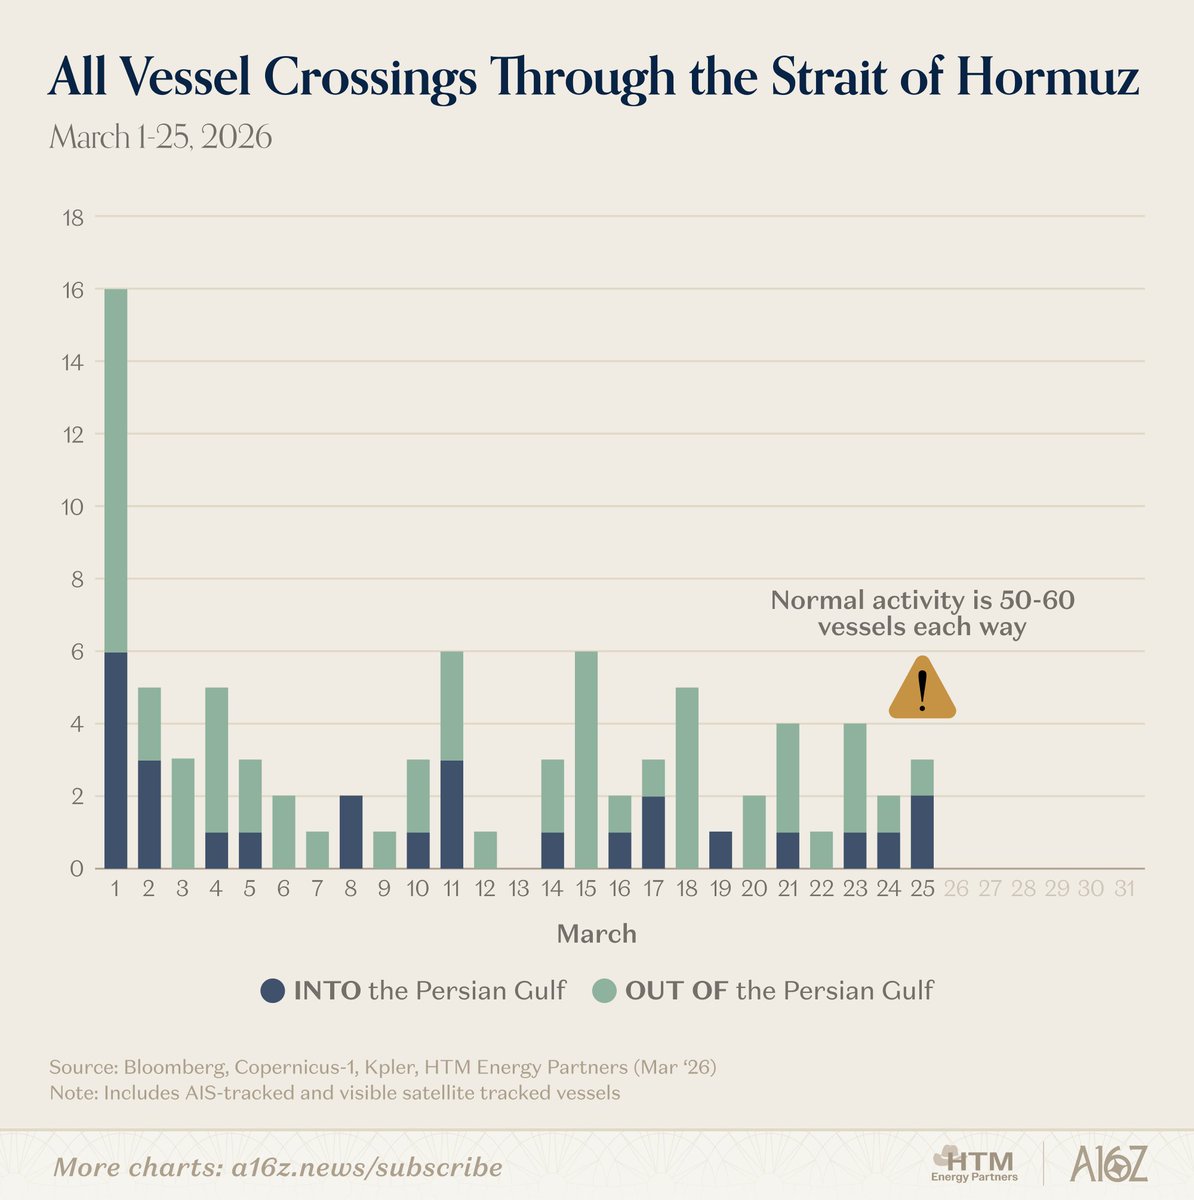
Very cool seeing the wave of empty tankers heading to the US to pick up some desperately needed crude for Hormuz-starved markets. All the tankers on the map below are empty VLCCs (~2 million barrel capacity each) currently heading for the US Gulf Coast.


Alto highspeed rail will boost Canada’s GDP by a whopping $35 billion. In indirect economic terms, it will pay for itself in two and a half years. It will also boost the economy, hire thousands, clean the environment, and make life better, more convenient and more affordable.


The next risk nobody is paying attention to