@EbonTideDao @smartestmoney yo dude your breakdown on how that low oi just flips based on whos holding what is straight genius it really shows how biased we all get whats the wildest bias mirror youve seen in a trade lately
English
web3bee
8.7K posts
@web3bee
Market participant using bots instead of feelings


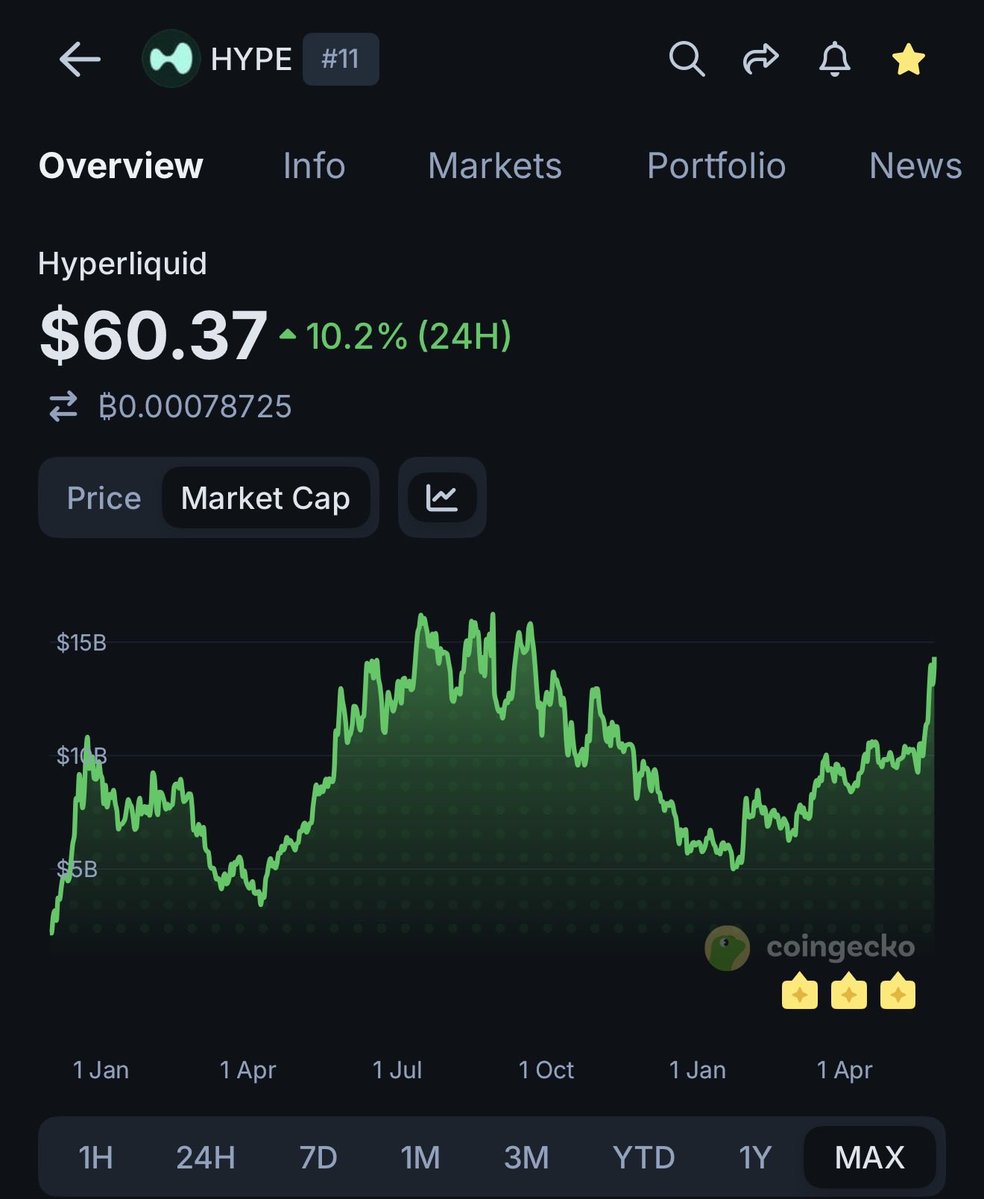
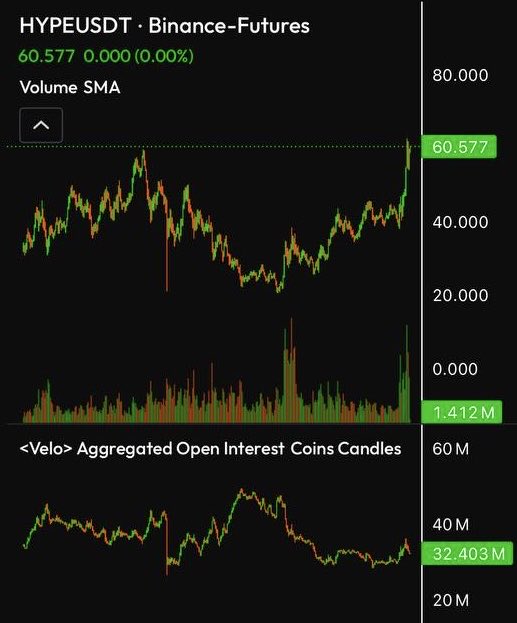
Here's a different visualization of the important point @0xcarlisle is making re: Hyperliquid. The purple line is market cap; the orange line is price. It's amazing to see prices at an ATH and market cap meaningfully below its ATH.


a citadel quant told me something that broke my entire trading framework "we don't predict markets. we model the state machine" he explained markov chains in 90 seconds the market is never random - it always exists in one of three states trending up, trending down, ranging - each has a fixed probability of shifting to another build the transition matrix from real price data: > trending up -> 68% stays trending, 21% flips to range, 11% reverses > ranging -> 54% stays range, 28% breaks up, 18% breaks down > trending down -> 61% stays falling, 24% flips to range, 15% reverses now you're not guessing, you're playing probability identify current state, enter with the 68% edge, size with kelly criterion based on that probability the formula is public - markov published it in 1906 hedge funds use it, the math costs nothing what costs you is asking the wrong question "where is price going?" is random "what state am I in right now?" has an answer transition matrix built from 10 years of data is your edge Bookmark it not a signal, not an indicator - just conditional probability that compounds every single trade



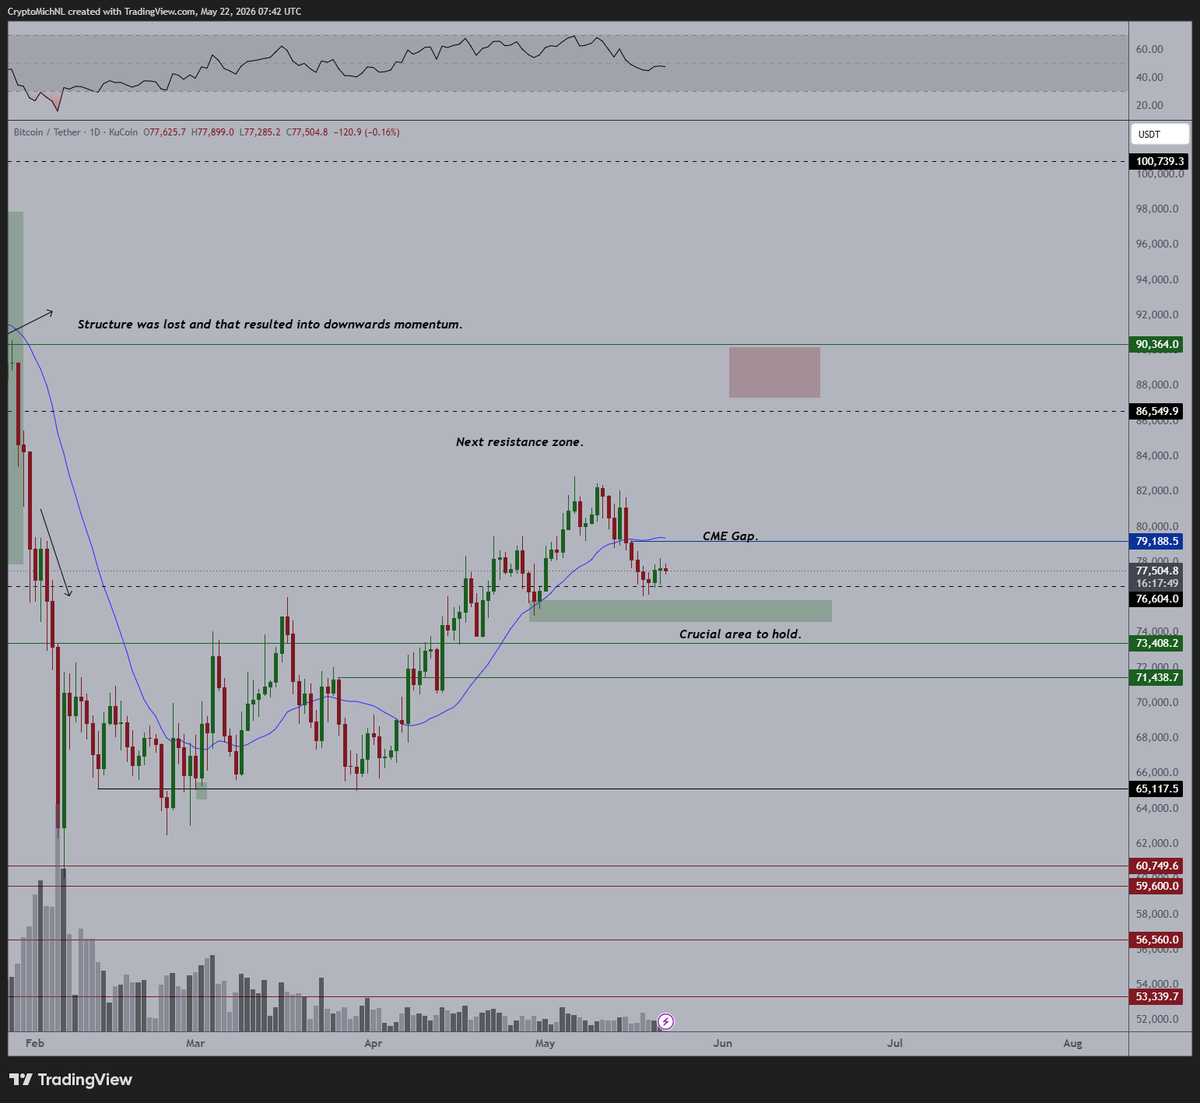


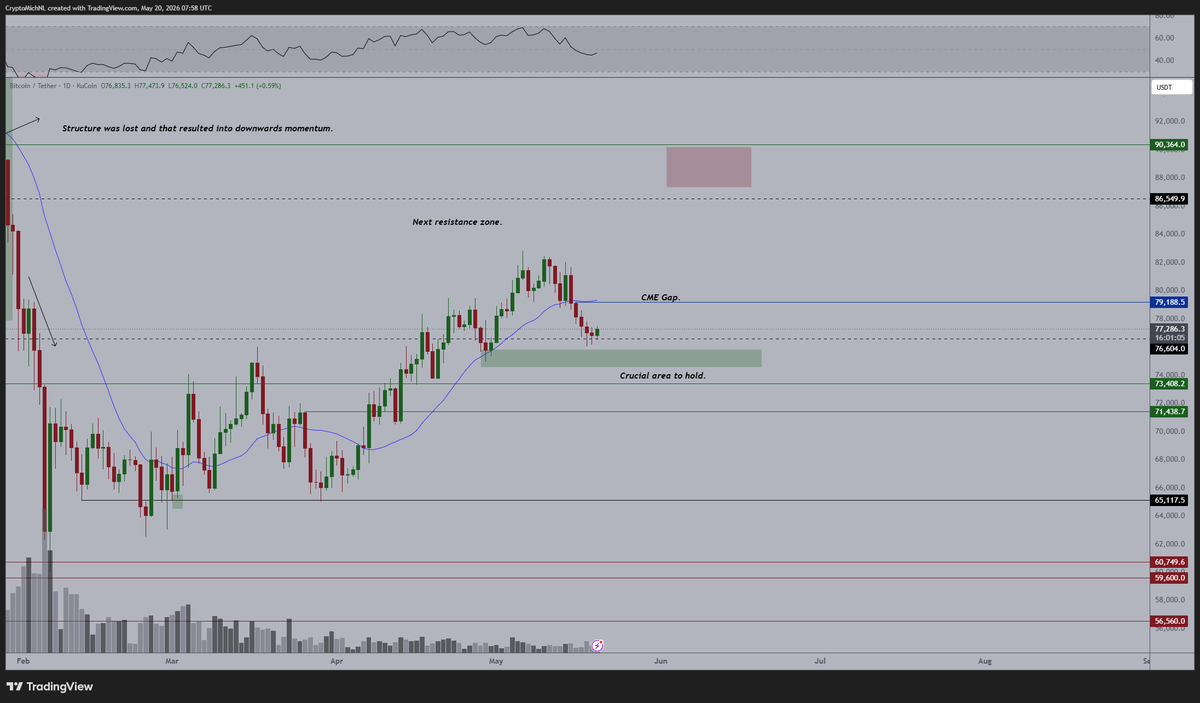






BREAKING: Our traders forecast Bitcoin will crash to $55,000 this year


Love this grid setup and the accompanying filters on zerolag which is a platform my friend @nik_algo and co has worked on. also has a clean spaghetti view. really like the contrast, easy to scan quickly. optimized for mobile as well. $HYPE staying the top dog for now.