David Pegler

4.2K posts

David Pegler banner
David Pegler

David Pegler

@ForexDavid

From PMB South Africa, Savannah GA, U.S. Army Vet, Trader, Market Breadth, Market Gamma, Vol Control.

Savannah, GA Katılım Nisan 2010
2.5K Takip Edilen2.9K Takipçiler
David Pegler retweetledi
Lifelong_Learner
Lifelong_Learner@j49576·
Keith and Ryan discuss the advantages of the Tier1Alpha data in this video snippet. @KeithMcCullough @HedgeyeAI @Hedgeye To provide proper credit, video clip taken from the Macro Show airing on 5/21/2026 hosted by Keith McCullough and Ryan Ricci.
English
0
3
5
3.9K
David Pegler retweetledi
Tier1 Alpha
Tier1 Alpha@t1alpha·
The collapse in skew over the past 6 weeks has created conditions for a less reactive $VIX relative to changes in $SPX, pushing spot/vol beta to a 12-month low.
Tier1 Alpha tweet media
English
4
10
49
9.4K
David Pegler retweetledi
Tier1 Alpha
Tier1 Alpha@t1alpha·
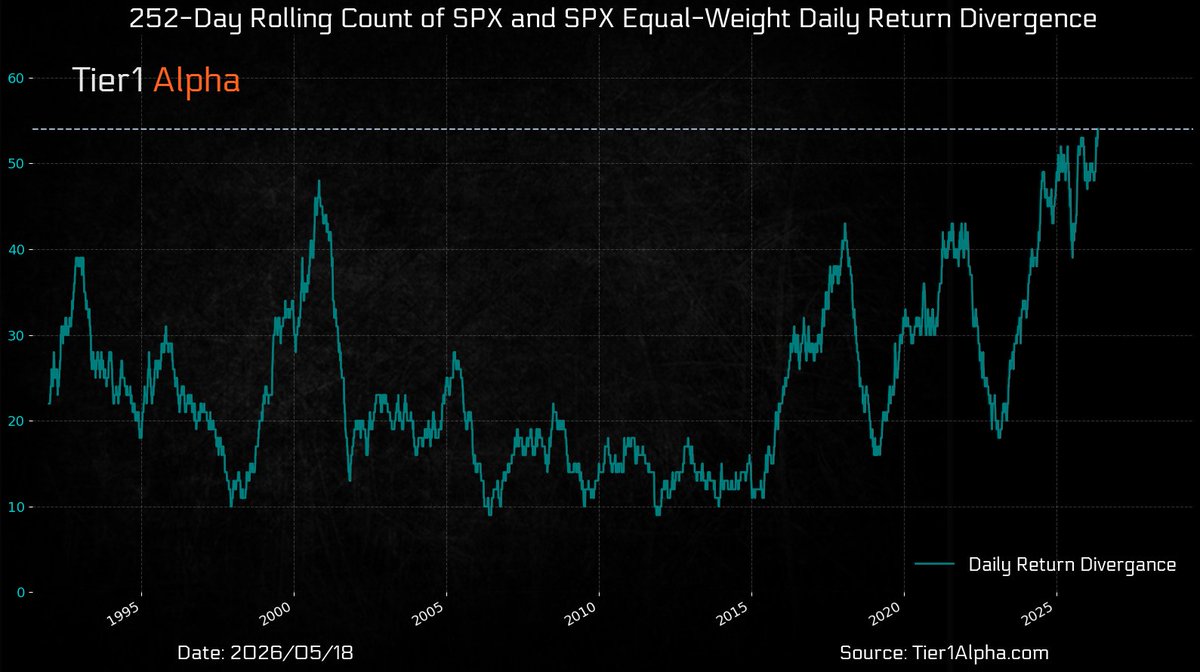
For added context, these internal divergences are becoming increasingly common, now far exceed the levels seen at the peak of the tech bubble. When these conditions eventually unwind, they tend to do so in spectacular fashion.
Tier1 Alpha tweet media
Tier1 Alpha@t1alpha

Huge breadth divergence today, and I’d expect more of the same into $NVDA earnings this Wed/Thurs. This is setting up to be the largest single-weighted earnings event in $SPX history.

English
4
7
42
8.8K
David Pegler retweetledi
Hedgeye
Hedgeye@Hedgeye·
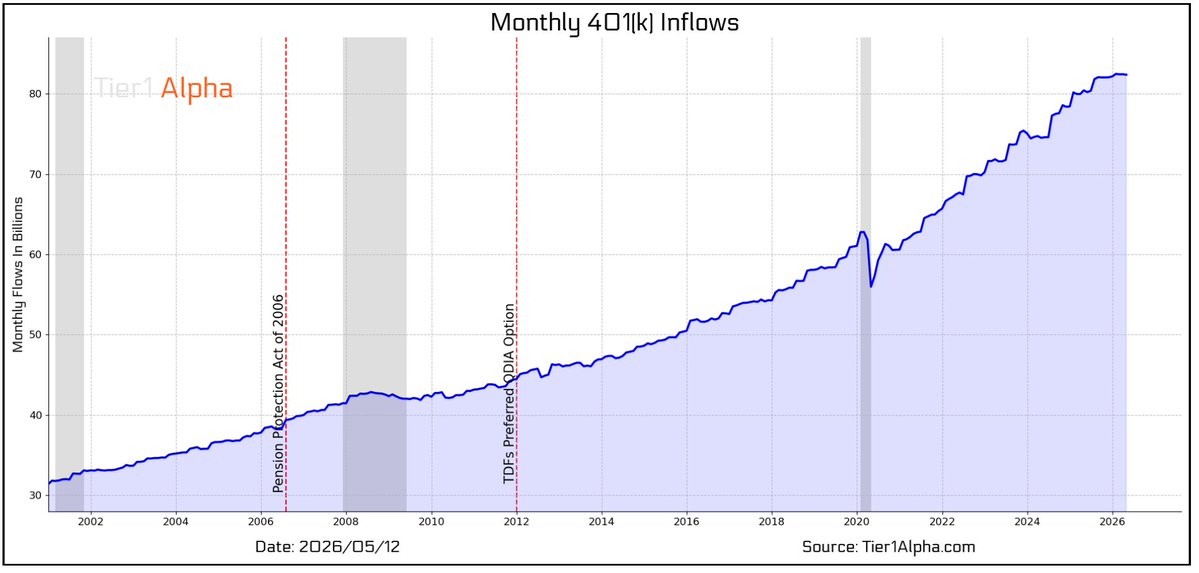
401(k) flows are slowing: Every two weeks, paychecks pour billions into 401(k)s, IRAs, and managed accounts. That cash buys index funds, index funds buy the stocks, the index rises, and rising prices attract more cash. A positive feedback loop on the way up. In reverse, redemptions force selling, the index drops, more redemptions follow. The down phase is faster and more violent than the up phase, and monthly inflows just stalled at $82B. 11,200 Americans hit 65 every single day, and the class of 2026 is the third weak grad cohort in a row. With low productivity young-adults on the sidelines and low productivity Boomers retiring, less inflows makes sense. Cleaner numbers are set to print on June 2. Watch the 401(k) flows.
Hedgeye tweet media
English
33
97
523
47.1K
David Pegler retweetledi
Tier1 Alpha
Tier1 Alpha@t1alpha·
Friendly reminder that $VIX up/ $SPX up into all-time highs is more of a feature than a bug.
Tier1 Alpha tweet media
English
7
8
92
15.9K
David Pegler retweetledi
Hedgeye
Hedgeye@Hedgeye·
Over 73% of all-time highs occur within 5 days of the prior one.
Hedgeye tweet media
English
9
30
119
12K
David Pegler retweetledi
Tier1 Alpha
Tier1 Alpha@t1alpha·
35% of today’s positive impact inside $SPX is coming from just 3 companies, each of which reported earnings within the last 48 hours. Nice boost in the short-term, but what’s left to drive momentum once the earnings impulse fades?
Tier1 Alpha tweet media
English
7
14
58
10K
David Pegler retweetledi
Neil Sethi
Neil Sethi@neilksethi·
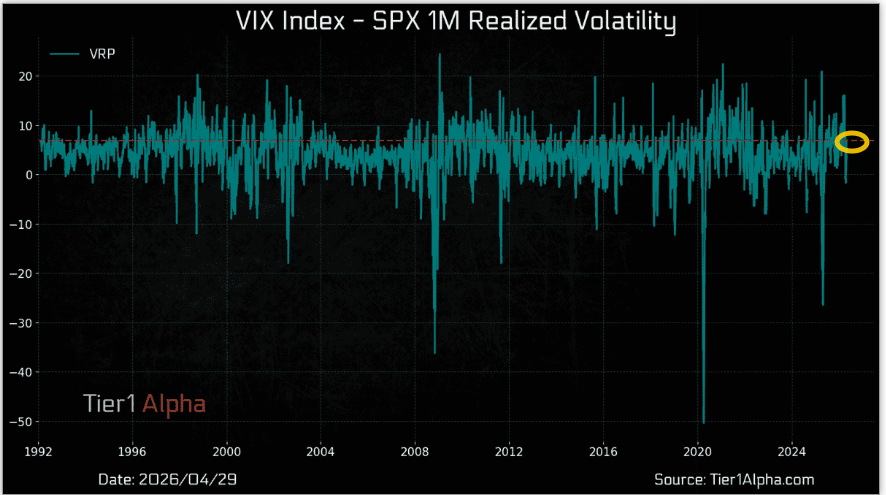
Tier1Alpha: While realized volatility continues to compress, implied volatility has been slower to follow. With the VIX still near 18, we're far from extreme levels, but it does suggest investors remain unwilling to fully price out the uncertainty tied to the Iran situation. As a result, the gap between implied and realized volatility remains elevated at roughly 7 points, indicating that a healthy premium remains embedded in the market.
Neil Sethi tweet media
Neil Sethi@neilksethi

Goldman: Index implied vols have reset materially since the start of the geopolitical conflict, but the 1m implied vol for the average single stock in the S&P has remained firm as investors shift from leaning on beta to actively picking winners and losers once again. The spread between the average single stock vol versus the index is now in the 99th percentile on both a 1y and 5y lookback.

English
0
1
15
3.2K
David Pegler retweetledi
Michael Green
Michael Green@profplum99·
Couple of amazing charts from @t1alpha
Michael Green tweet mediaMichael Green tweet media
English
0
12
84
27.2K
David Pegler
David Pegler@ForexDavid·
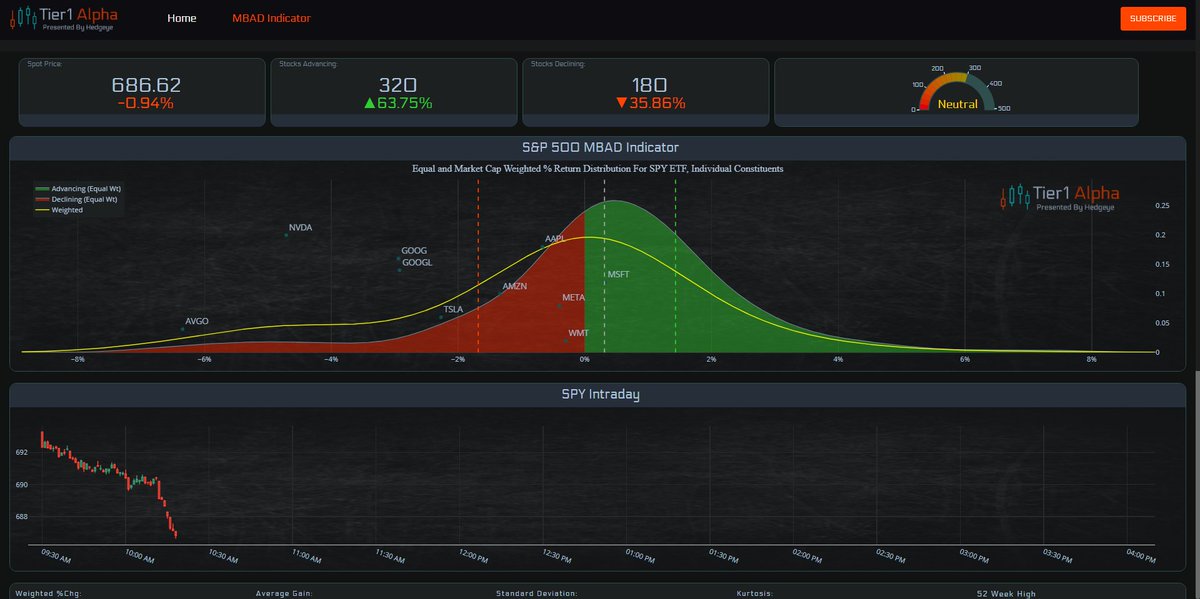
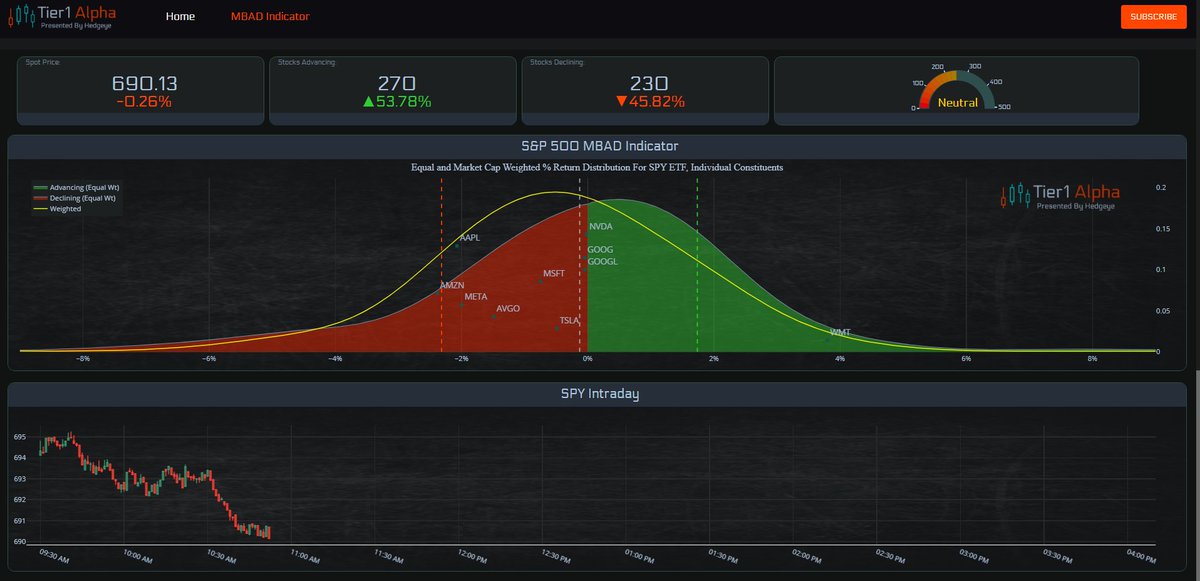
Interesting breadth profile. Today's $SPY market in 36 seconds. Data @t1alpha
English
2
2
11
1.9K
David Pegler retweetledi
Ralph Sueppel
Ralph Sueppel@macro_synergy·
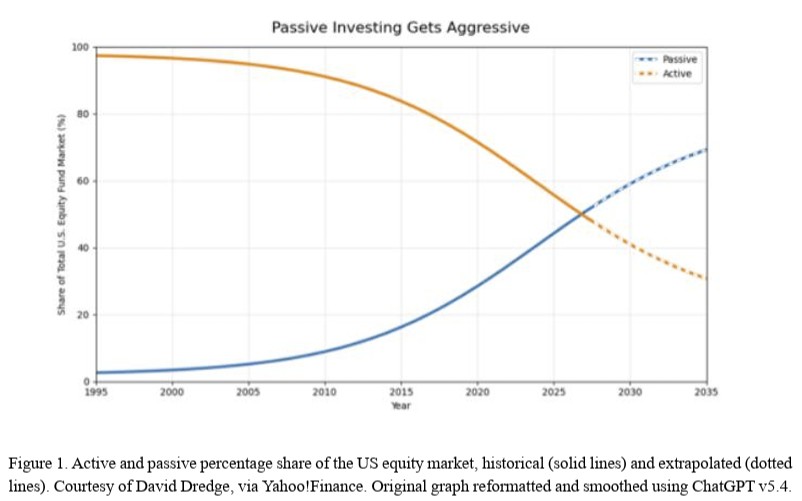
“A Model for Passive That Breaks the Market”: “Passive funds do not base their investment decisions on any notion of fundamental value… Once the passive share reaches around 65%, index volatility may increase sharply. At 90% share, an increase in volatility at cubic speed is nearly inevitable, leading to exaggerated boom and bust cycles.” papers.ssrn.com/sol3/papers.cf…
Ralph Sueppel tweet media
English
7
26
124
23.4K
David Pegler retweetledi
Neil Sethi
Neil Sethi@neilksethi·
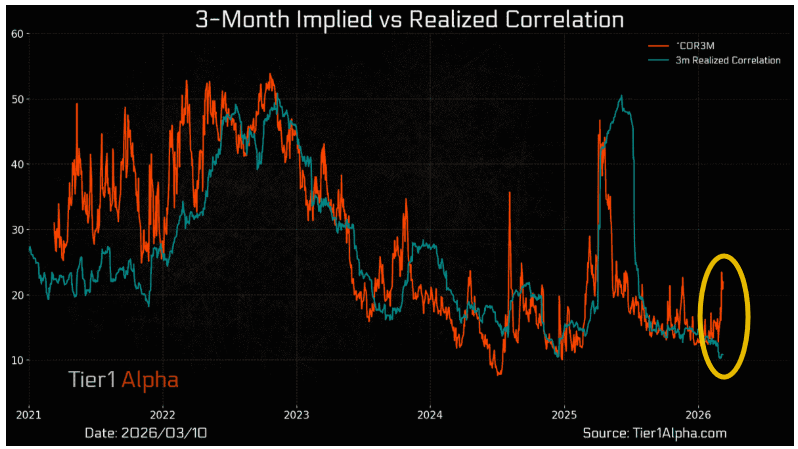
Tier1Alpha: The jump in the volatility surface is largely being driven by a jump in implied correlation -- this jump is what we see when we discuss skew. Single-name options do not typically price skew (occasionally, this will be violated around company-specific events like earnings). Skew is essentially telling us that the risk of ALL stocks moving lower in a coordinated fashion is significant. Yet while implied correlation has risen sharply above realized correlation in a manner similar to the period immediately ahead of the Feb 2025 Tariff Tantrum, we are not yet seeing any signs of capitulation.
Neil Sethi tweet media
English
2
2
15
4.3K
David Pegler retweetledi
The Kobeissi Letter
The Kobeissi Letter@KobeissiLetter·
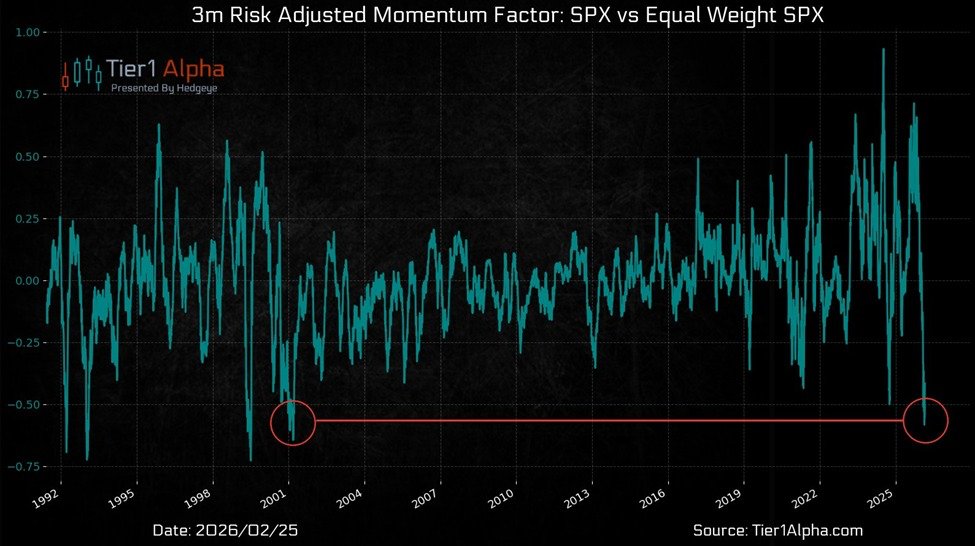
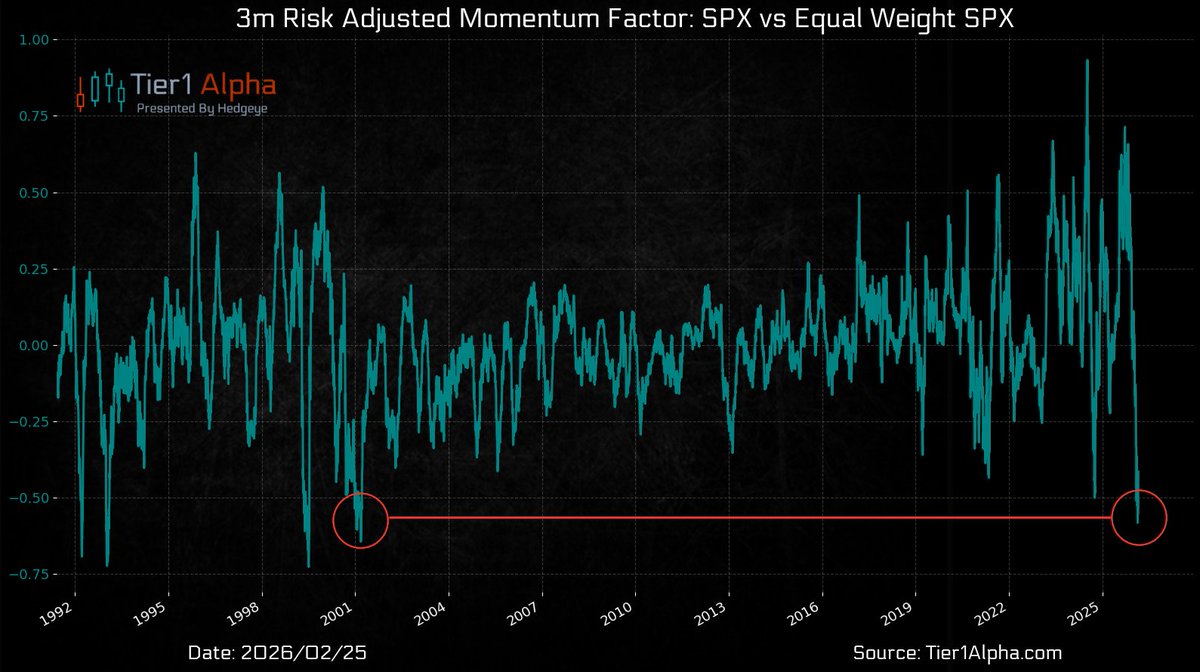
This is incredible: The 3-month risk-adjusted momentum factor between the S&P 500 cap-weighted and equal-weighted is down to -0.60, the lowest since the 2000 Dot-Com Bubble burst. In simple terms, this means large-caps delivered the weakest volatility-adjusted performance compared to the average stock in 25 years. This marks a sharp reversal from the +0.60 reading in November, when large-caps were leading the market. As a result, the S&P 500 equal-weighted index is outperforming the S&P 500 by 5 percentage points, the widest margin in at least 36 years. The last time such a reversal in performance occurred was in 2000, when the equal-weighted S&P 500 surged 18 percentage points against the cap-weighted index over the following year. Mega-cap tech stocks have gone from market leaders to market laggards.
The Kobeissi Letter tweet media
English
89
114
961
178.8K
David Pegler
David Pegler@ForexDavid·
Large divergence between weighted (Yellow) and equal weight breadth today. @t1alpha
David Pegler tweet media
English
1
0
6
269
David Pegler retweetledi
Tier1 Alpha
Tier1 Alpha@t1alpha·
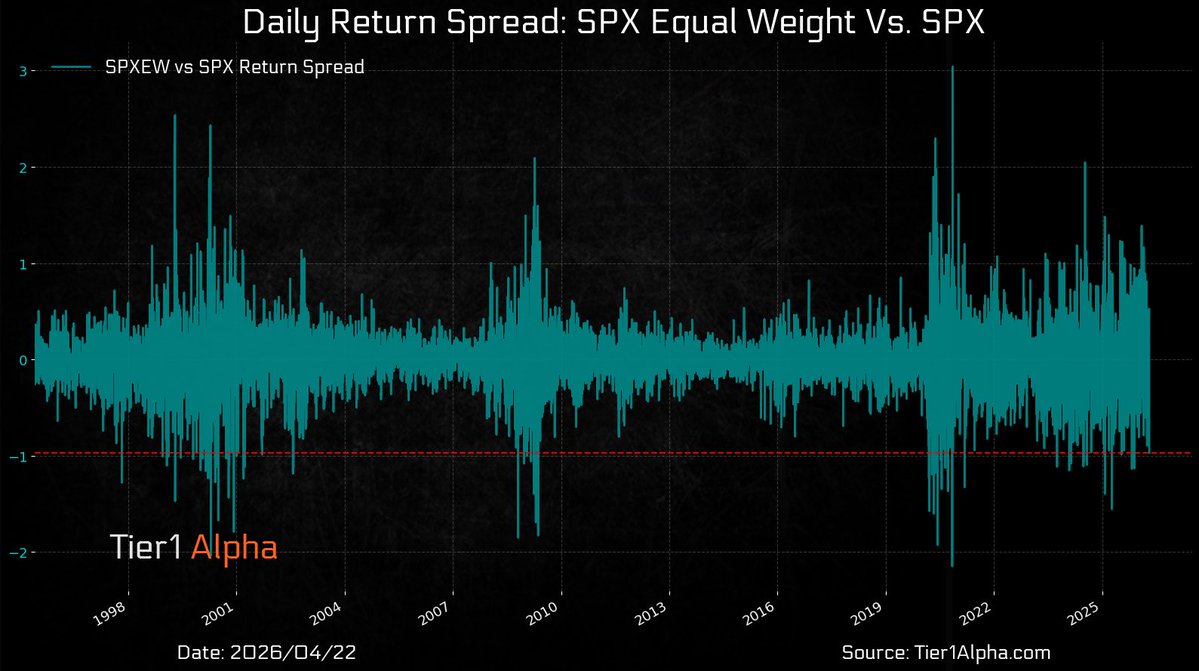
The past 3 months have been the worst period to own $SPX relative to its equal-weight index since 2001.
Tier1 Alpha tweet media
English
6
24
129
23.3K
David Pegler
David Pegler@ForexDavid·
Cap weighted breadth substantially worse than equal weight. For a few reasons Craig @t1alpha has been highlighting this vulnerability for a few days.
David Pegler tweet media
English
0
0
4
255
David Pegler
David Pegler@ForexDavid·
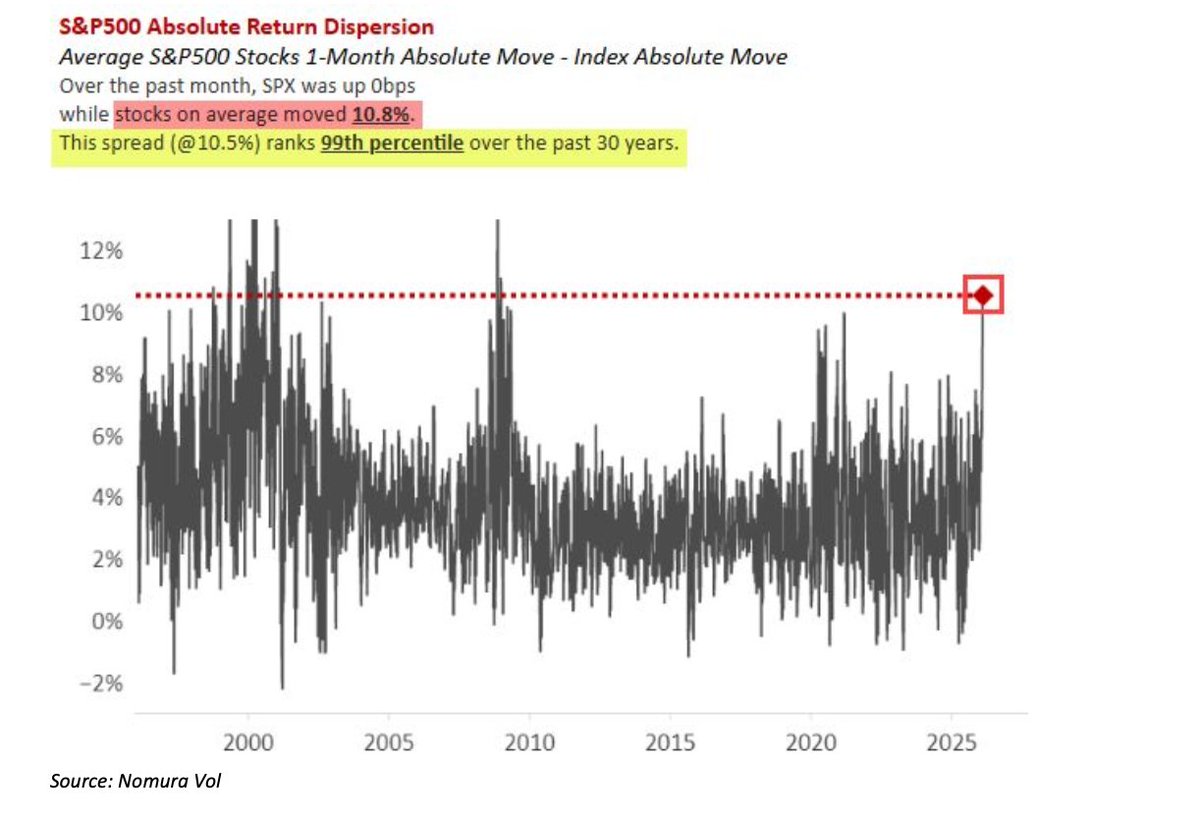
RT @noelsmith: Dispersion trade continues to print money. Chart via Nomura. @t1alpha and I talk of this often.
David Pegler tweet media
English
0
1
0
56
David Pegler retweetledi
Richard Farr
Richard Farr@farrmacro·
So if you are a disciple of @profplum99 this means that passive investing flows will have an INCREASING impact on the market going forward (some have argued that buybacks were more impactful). Why does this matter??? Because if jobs go south, so do passive flows. And if there’s no buybacks to offset that, this could be a hell of a down year.
zerohedge@zerohedge

There will be zero buybacks among the Mag 7 this year.

English
1
2
9
3.1K