HB Strategies
123 posts

HB Strategies
@HBMStrategies
Quantitative market research & systematic trading ideas. Backtested signals · Data-driven analysis · Own views only. Not financial advice. Do your own research.

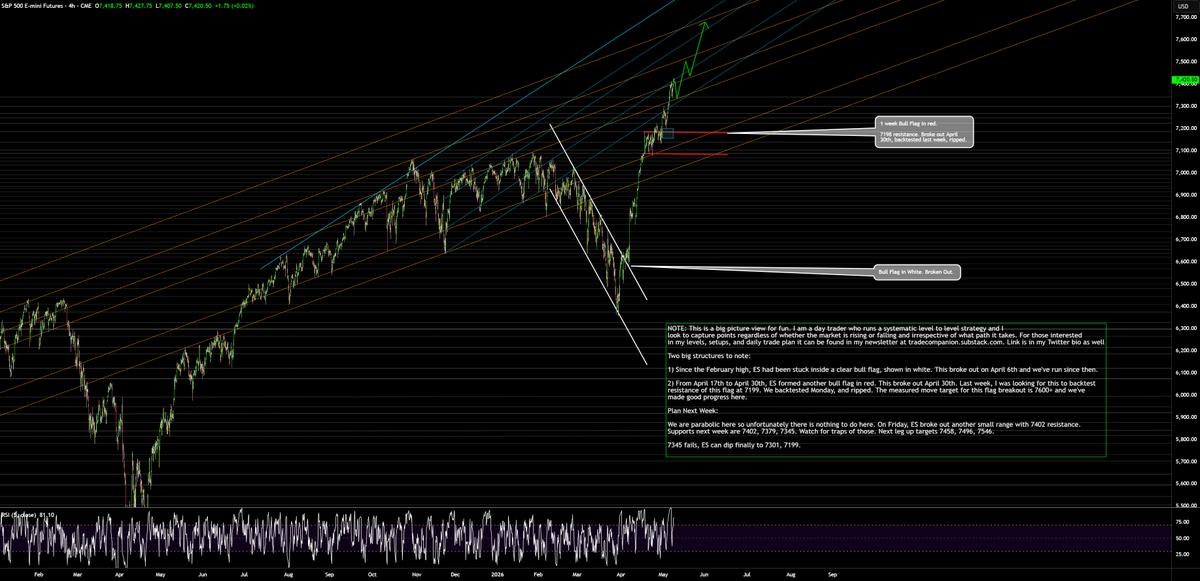

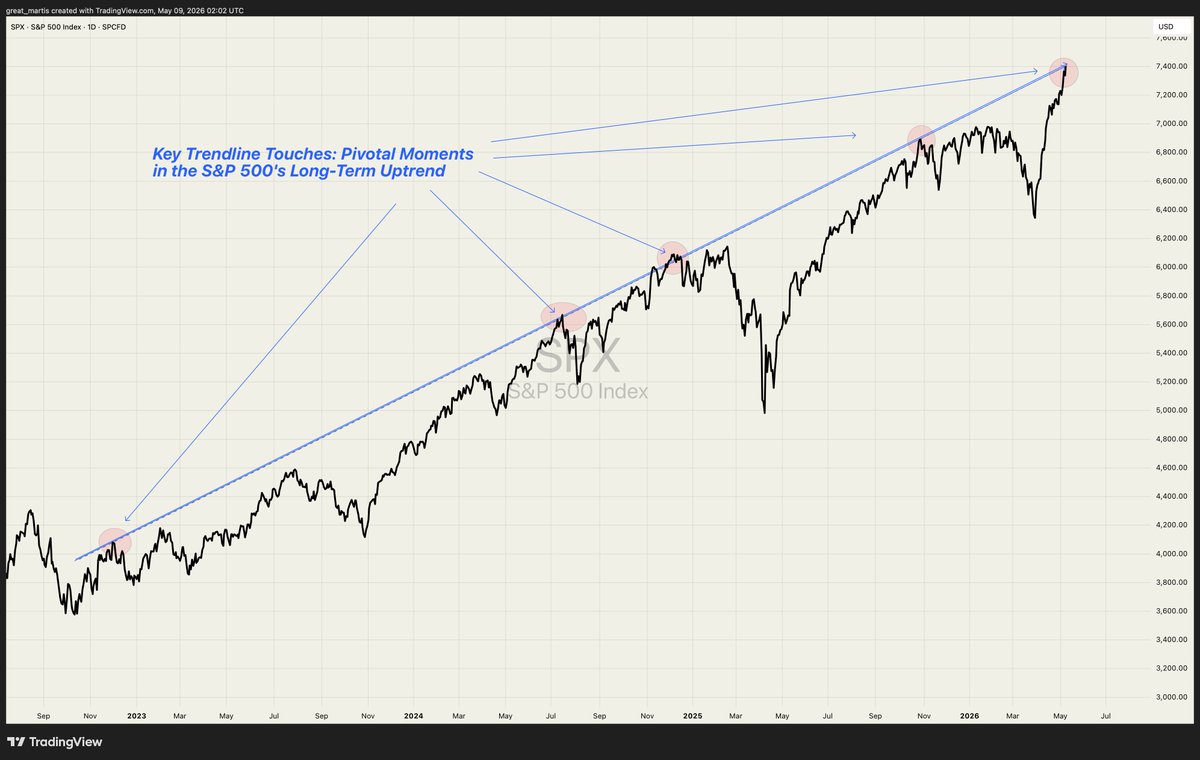
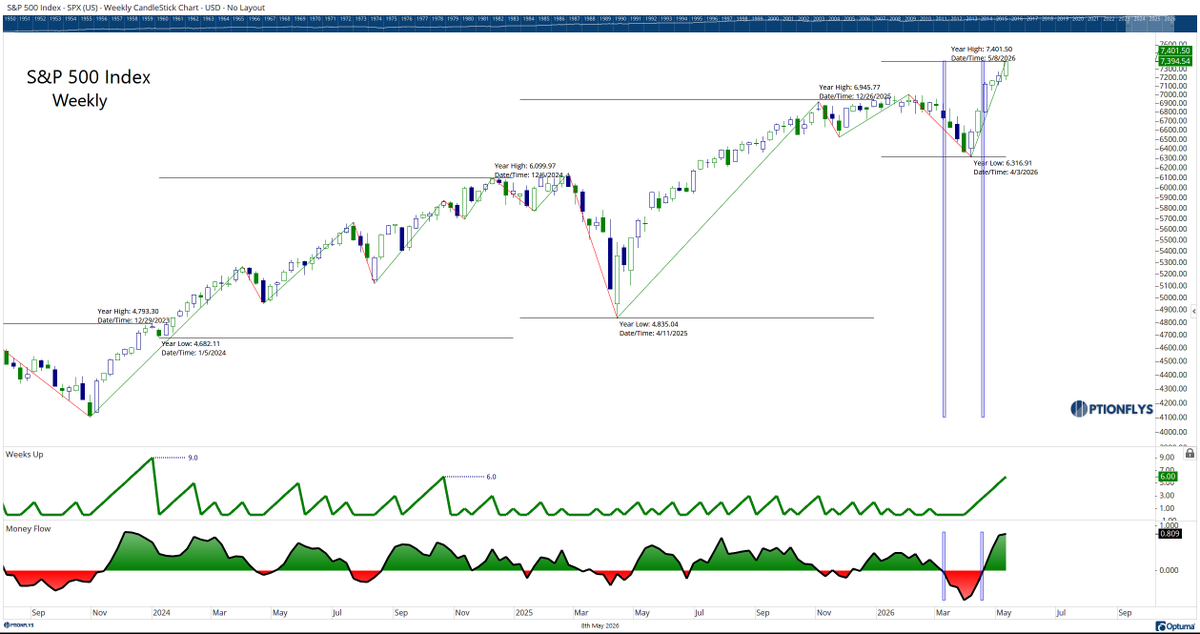
BREAKING: The S&P 500 officially rises above 7,400 for the first time in history, now up +17.2% since March 30th. That's now +$10 TRILLION in market cap in 29 trading days.

Markets Update - 5/8/26 A look at what happened today impacting US equity, Treasury, and selected commodity markets, and what to watch for next week neilsethi.substack.com/p/markets-upda…


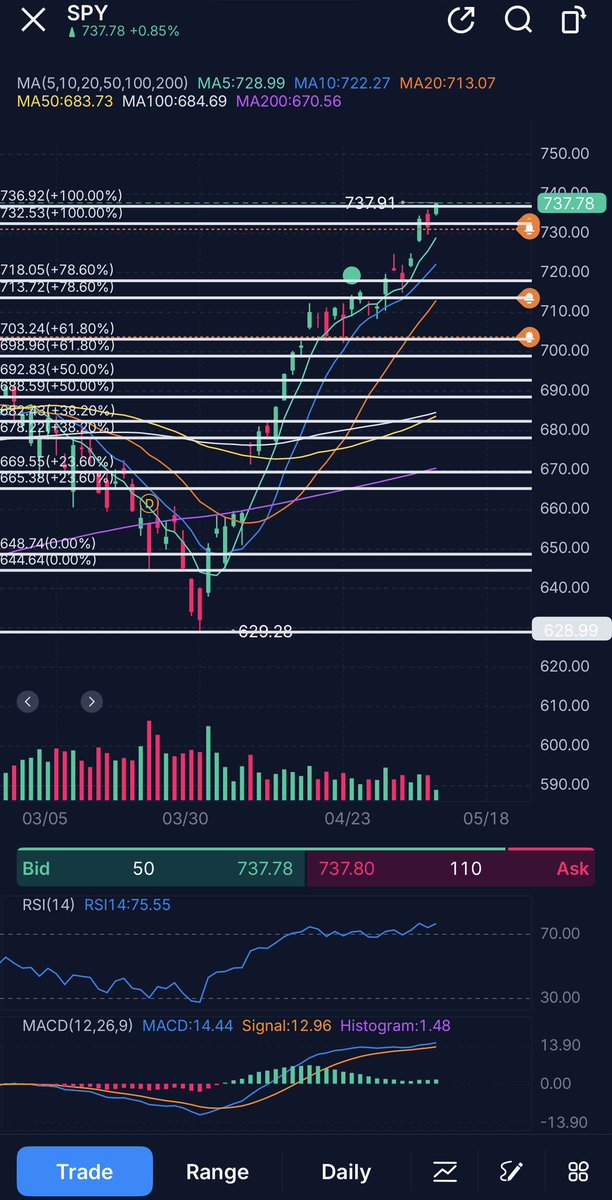


$SPY I’ve been having daily FOMO to long since price broke out of 718. If I had done it I would have made money now, but then I’d go on and lose a lot more in the long run, because if I FOMO now, I’ll FOMO again, and while it’s currently rewarding, it won’t be for long, and it often isn’t. It’s actually the number 1 trading account killer. For me to go long I need price to drop to the 20 dma and hold. If that doesn’t happen I won’t long and I will happily watch it rip all the way to 785-791 from the sidelines, and I’ll be totally fine with it. I don’t know what’s everyone’s financial situation is but I don’t need to trade all the time to make ends meet. This is not directed to Bradley, I don’t know him, this is for everyone, If you need to trade to cover your bills, don’t. Make enough money first then come back to trading.

🚨 SOMETHING VERY STRANGE IS HAPPENING S&P 500 just hit a new all-time high of $7,000. Right in the middle of the worst energy crisis in decades. But almost nobody is talking about the real reason. The market is pretending the crisis is over. But the Strait of Hormuz is still closed. Oil is above $90. While the real economy suffocates, the index is being pumped to create exit liquidity for smart money. The gap between the chart and reality is dangerous. I've seen this movie before: When the index flies during an energy shock, the drop will be vertical. Remember, I've called every major turn for the last 10 years, including the exact $16K bottom three years ago and the $111K top in October. Turn on notifications. When the real bottom forms, I'll call it here publicly, like I always do.


HEY $SPY ALL WE WANT is a pullback to the ATR and cloud. Is that too much to ask? Lmao! #SPX #SP500

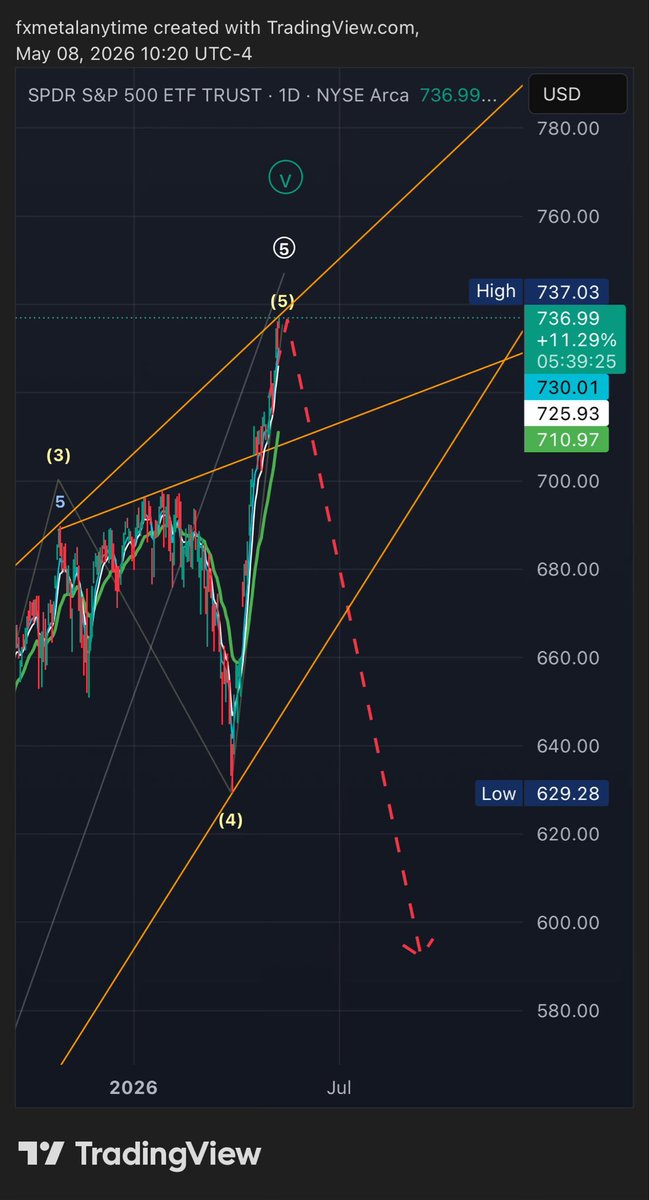
🚨 S&P 500 MADE A FALSE BREAKOUT ABOVE RESISTANCE... Price is holding above the $7,220 level, which on the surface looks like a strong breakout to the upside For most market participants, this is seen as a bullish signal, but the underlying structure may be more complex Moves like this often turn into false breakouts, followed by sharp reversals to the downside Whales often use these moves to distribute, selling into retail FOMO as downside risk fades If this scenario plays out, a move above $7,220 could still lead to a reversal toward $6,300–$6,000, with potential for further downside continuation What’s your take on this move? Drop your thoughts in comments... Turn on notifs, I’ll update soon