
jp
137 posts


1/BTCUSD is entering its DCL timing window.
Time to add to $BTC shorts is near.

ConvexEdge@ConvexEdgeX
Update: $BTC hedge longs. If a DCL confirms in the coming days, I expect a bounce lower than 80K.
English
@kingcobratrader @GeoMetric_9 mentioned it might bottom at around 67,5k, while @camelfinance provided the cycle low window and the direction move since days. No surprise, right?
English


The stock market is in what I believe is a historic,final parabolic leg of a 44 yr secular bull market.I am raising some of my targets as follows: SPX 10,000, Nasdaq Comp 36,000, DJIA 67,000, RUT 4000, QQQ 950, SMH 800, gold $7000 & silver $200. My other targets remain unchanged.
English
@kingcobratrader @camelfinance might have said: Cyles are in control, everything else is narrative…
English
Stocks had a minor pullback and $BTC got rekt.
Goes to show the weakness still.
English
@TheBigCycleGame On July 4th Trump will say "The best is yet to come...". That's the sell signal IMO.
English

PART 1 — THE STRUCTURE
A look at two charts.
Left: S&P 500. 1995–2000.
Right: S&P 500. 2014–2026.
The structure is identical.
Two major corrections. Marked green.
Smaller consolidations along the way. Marked orange.
Then the final parabolic phase.
───────────────
One step further.
Take the move from the 1998 low
to the first intermediate high.
Clone it. Project it forward.
Left: target zone ~1,550–1,575.
Actual dotcom top March 2000: ~1,553.
The projection hit within 1%.
Apply the same method to today.
Same structure. Same clone. Same projection.
Target zone S&P: ~8,200–8,500.
───────────────
Now the time dimension.
Dotcom S&P: large move 77 days.
Final acceleration: 21 days.
Compression factor: 3.67x.
Today: large move 294 days.
294 ÷ 3.67 = ~80 days from the March 2026 low.
That points to approximately mid-June 2026.
Timing is always the hardest part.
Structures stretch. Windows shift.
With every leg up the velocity increases —
not decreases.
That is the signature of a blow-off top.
Not a slow top.
───────────────
Two frameworks pointing in the same direction.
Technical price projection: ~8,200–8,500.
Time compression factor: ~mid-June 2026.
Different methods.
Same destination.
───────────────
One more thing worth remembering.
The S&P is not the economy.
The economy is the consumer.
70% of US GDP is consumer spending.
Not AI capex. Not Mag 7 earnings.
Not data centers.
What is being priced into markets today
does not yet exist in the real economy.
AI will transform industries.
That is not in dispute.
But markets are pricing tomorrow's earnings
while today's consumer is already under pressure.
Real wages: falling.
Credit card delinquencies: GFC levels.
Housing volume: lowest since 2009.
The structure says where we are.
The data says what is underneath.
───────────────
One reason this projection
may be more relevant than it appears:
Nobody is looking at this window.
Because many are searching
for convergence in a time
of maximum divergence:
Midterm years are historically strong.
Particularly in the month of October
and the months following.
"Sell in May" suggests nothing happens in summer.
Crypto is also looking toward autumn.
Major voices see one to two more years.
Attention is everywhere
except the next few weeks.
Tops form precisely when
the majority is not positioned for them.
Not because of the structure alone —
but because maximum complacency
and maximum structural tension
rarely arrive together.
Right now they have.
This is not a guarantee.
Fractals stretch. Timing shifts.
But the convergence is worth
watching very carefully.
CIF: 82/90 (91.1%) — Danger Zone.
@TheBigCycleGame
Not financial advice. DYOR.
#SPX #DotcomFractal #EndCycle
#CIF #MacroAnalysis #FinalPhase
#BusinessCycle #Contrarian


English
@TheBigCycleGame I can not imagine a scenario where on July 4th we are not in europhoric mode, higher from here. Trump will pull all strings re: Iran, China & Russia to have never seen before euphoria for the 250th anniversary…
English
DOTCOM FRACTAL UPDATE
Sunday, May 10, 2026
S&P 500
Close: 7,398
Weekly: +2.3%
Above Jan ATH: +5.6%
From March low: +17%
Distance to target: ~8-10%
The S&P is not only tracking
the dotcom fractal in structure.
It is now running ahead
of the dotcom timeline
in magnitude as well.
5.6% above its January all-time high.
In six weeks.
In the dotcom compression,
this level was reached
over a significantly longer period.
The compression is accelerating —
not stabilizing.
───────────────
On a weekly basis:
no divergences in classical indicators.
Structure remains intact.
On a daily basis:
first divergences are forming.
They have been building
for several days now.
This does not mean the top is in.
It means the final phase
is approaching its conclusion.
───────────────
A pullback must always be expected.
As outlined in last week's analysis:
a correction in the double-digit range
remains a possibility —
and could occur
within a very short timeframe.
But the compression factor
changes the calculation.
The pullback may not need
to be as deep as 1999-2000 suggested.
And it could be resolved
faster than most expect —
bought aggressively
by everyone who missed the rally
and has been waiting for exactly
this moment to enter.
───────────────
June and July
remain the realistic window
for the final top.
There is never a guarantee.
The current compression factor
allows for a significantly
faster conclusion.
This is the scenario
I am tracking most closely
right now.
───────────────
And one final indicator —
the one that requires
no chart, no subscription,
no technical expertise.
When friends, neighbors,
colleagues, and acquaintances
who have never discussed markets
suddenly want to talk about stocks —
when people who have never
asked you about investing
start asking which AI company
you are buying —
when the dinner conversation
turns to portfolios —
that is the signal.
That moment has not arrived yet.
When it does —
it will be time.
───────────────
Target: 7,800-8,100
Upside: ~8-10% from here
Weekly: no divergences
Daily: first divergences forming
Window: June — July 2026
Compression: faster finish possible
───────────────
@TheBigCycleGame
Not financial advice. DYOR.
#DotcomFractal #SPX #Russell2000
#EndCycle #MacroAnalysis #LCIF
#BlowoffTop #FinalPhase #Compression
#Contrarian #ATH #WeeklyUpdate

English
@TheBigCycleGame End of May: Deal with China. End of June: SpaceX IPO. July 4th: Peak euphoria. Maybe.
English
DOTCOM FRACTAL UPDATE
Sunday, May 3, 2026
S&P 500 — THE COMPRESSION ANALYSIS
Close: 7,230
Weekly: +1.1%
Peak this week: 7,272
Above Jan ATH: +3.26% (peak: +3.87%)
From March low: +15%
───────────────
THE 1999-2000 ROADMAP
I track the dotcom fractal
not as a prediction —
but as a historically validated
pattern projected into today.
Here is the precise sequence
from 1999-2000:
October 1999: S&P bottoms.
Week 5: first new ATH.
Weeks 6-9: consolidation around ATH.
Week 10: clean breakout.
Week 12: local top ~4% above prior ATH.
Same week: correction begins.
That correction ran 8-9 weeks.
Depth: approximately -10%.
Local bottom: late February 2000.
Then: final rally of 3.5 to 4 weeks
into the March 2000 all-time high.
Total from October low
to March 2000 top: ~23 weeks.
───────────────
THE 2026 COMPRESSION
March 2026: S&P bottoms.
Week 2.5: new ATH broken.
Peak: +3.87% above January ATH —
almost exactly matching
the dotcom fractal's
4% overshoot level
I flagged weeks ago
as the target zone 7,200-7,300.
The compression factor: ~4-5x.
The move that took 12 weeks in 1999
took approximately 5 weeks in 2026.
───────────────
WHAT COMPRESSION MEANS
FOR WHAT COMES NEXT
If the fractal continues
at the same compression ratio:
The correction phase —
which lasted 8-9 weeks in 2000 —
compresses to approximately
2-3 weeks in 2026.
The final rally —
which lasted 3.5 to 4 weeks in 2000 —
compresses to approximately
1-2 weeks in 2026.
───────────────
ONE MORE LAYER:
THE OVERSHOOT
This is the phase
most models don't account for.
Final blow-off tops
rarely end cleanly
at a projected target.
Institutional flows already exceed
the 2021 meme stock peak.
Private investors still on sidelines.
Media coverage still moderate.
When retail follows institutional —
and the narrative of
"resilient economy"
fully crystallizes —
the final move can overshoot
any rational target
by 1-2 additional weeks of momentum.
Euphoric final phases
have a habit of running
further and faster
than even the bull case suggests.
That overshoot potential
is real in this setup.
───────────────
Combined: the entire remaining sequence —
correction, final rally,
and potential euphoric overshoot —
could play out in
4-8 weeks from here.
That points to a window
of late May to late June 2026
for the final top.
With the possibility of
a sharp, compressed euphoric extension
into early July
that catches most participants
completely off guard.
───────────────
THE FRACTAL CALLED THIS
Weeks ago this analysis flagged:
target zone 7,200-7,300.
4% above the January ATH.
Based purely on the dotcom parallel.
S&P peak this week: 7,272.
+3.87% above the January high.
Not a prediction.
A historically validated pattern —
playing out almost to the point.
───────────────
Target: 7,800-8,000
Upside: ~8-11% from here
Overshoot: 7,200-7,300 zone reached
Final window: late May — late June 2026
Euphoric ext.: early July possible
Structure: dotcom fractal intact
───────────────
@TheBigCycleGame
Not financial advice. DYOR.
#DotcomFractal #SPX #EndCycle
#MacroAnalysis #Contrarian #LCIF
#BlowoffTop #FinalPhase #ATH
#Compression #Russell2000 #WeeklyUpdate

English


WEEKLY MACRO UPDATE — April 26, 2026
───────────────
MARKETS
S&P 500
Weekly: +0.65%
Close: 7,165
Above old ATH: +2.3%
From lows (4 weeks): +13%
Russell 2000
Weekly: +1.4%
Close: 2,785
From lows (4 weeks): +16.5%
Retest of January ATH: completed
Nasdaq
Weekly: +2.5%
Above October 2025 high: +4.25%
From lows (4 weeks): ~+20%
Bitcoin: ~78,000
Ethereum: ~3,300
───────────────
DOTCOM FRACTAL
All three major indices
showing bullish triple cross
on the weekly timeframe —
MACD, RSI, Stochastic RSI
simultaneously confirmed.
Historically rare.
S&P: room for one more leg
toward ~7,200 before a first correction.
Russell: final target 3,000-3,200.
Overshoot not excluded
in a strong euphoria phase.
Structure intact.
Fractal on track.
───────────────
EARNINGS — THIS WEEK IS THE PEAK
27% of S&P 500 reported so far.
86% beat estimates.
Average beat: +12.8%.
Sixth consecutive quarter
of double-digit earnings growth.
Intel: +110% from correction low.
SOXX Semiconductor ETF:
+40% in 18 trading days.
Best performance in 24 years.
This week:
the biggest earnings week
of the entire season.
Wednesday April 29 — after close:
Microsoft. Alphabet. Meta. Amazon.
Same evening as the FOMC decision.
Thursday April 30:
Apple.
May 20:
Nvidia.
Four of the world's largest companies
reporting on the same evening
the Fed announces its rate decision.
That is an extraordinary
concentration of market-moving events
in a single session.
If even one of the four
disappoints on guidance —
the reaction will be swift.
───────────────
FOMC — APRIL 28-29
Rates expected unchanged
at 3.50-3.75%.
Powell's commentary on Iran,
inflation expectations,
and labor market will be watched closely.
Michigan Consumer Sentiment:
final April: 49.8.
Lowest level since records began in 1978.
Below every recession-start reading
in the survey's 74-year history.
Inflation expectations:
year-ahead surged to 4.7%.
Largest one-month increase since April 2025.
The consumer is not fine.
The market is at all-time highs.
That gap is not noise.
That is the defining divergence
of every major cycle top.
───────────────
IRAN — WHAT THE MARKET IGNORES
Markets are pricing deeskalation.
A ceasefire. A deal. Relief.
What is not being priced:
the disruption already caused
will not simply reverse.
Hormuz closed for weeks.
Supply chains rerouted.
Energy infrastructure disrupted.
Trade volumes affected.
These are not overnight recoveries.
They are structural shifts
that will show up in data
over the coming months —
long after the headlines move on.
A ceasefire removes the acute risk.
It does not undo the damage.
───────────────
PSYCHOLOGY — WHERE WE ARE
Four weeks ago:
the US market was written off.
Structural break. Top is in.
Today:
+13% on the S&P.
+20% on the Nasdaq.
Record semiconductor performance.
86% earnings beat rate.
The crowd waiting for the pullback
is still waiting.
And now —
FOMO is building.
The narrative is shifting:
the American economy
is resilient against all crises.
The earnings prove it.
The recovery proves it.
This narrative will likely dominate
in the coming weeks.
It is also the exact narrative
that dominated in Q1 2000.
And in Q1 2007.
Strong data. Record earnings.
And then the cycle turned.
When corrections come
in this environment —
they will be bought aggressively.
Because everyone missed the rally.
Because the earnings look strong.
Because the narrative says all is well.
That is how shallow corrections form.
And that is how final phases extend.
───────────────
BITCOIN & CRYPTO
In the shadow of the equity rally,
crypto is building quietly.
Bitcoin: ~78,000.
Working through resistance.
The consensus in crypto:
we are in a bear market.
30-40K is still possible.
Even an 80-90K recovery
means nothing — just like 2022.
But the correlation between Bitcoin
and the Nasdaq is structural.
Bitcoin has never experienced
a real recession.
Every cycle it lived through —
2018, 2020, 2022 —
occurred under QE,
rate cuts, or massive fiscal stimulus.
The traditional markets
are showing what a final phase looks like:
violent, fast, unexpected.
It should not surprise anyone
if crypto follows —
with the same velocity,
the same compression,
the same disbelief.
The macro backdrop does not support
a new long bull cycle.
But it does support
one final euphoria phase —
before the cycle ends.
Crypto's FOMO moment
has not happened yet.
Every other asset class
already had its.
@TheBigCycleGame
Not financial advice. DYOR.
#WeeklyUpdate #MacroAnalysis #SPX
#Russell2000 #Nasdaq #DotcomFractal
#LCIF #EndCycle #Earnings #FOMC
#Bitcoin #Crypto #FinalPhase
#Microsoft #Meta #Alphabet #Amazon
#Contrarian #MaxPain

English


@FroehlichThors1 @PWebborn Thorsten, for transparency, are you a paid affiliate for Henrik, and Paul?
English
Ever since the launch of EW 2.0, Paul and Henrik’s creation has been on a steady upward trajectory - one where you can trace its evolution by revisiting the work along the way. As you’d expect, it only gets sharper with time, with member questions and requests not just heard, but thoughtfully addressed.
Consider this yet another recommendation.
Paul Webborn@PWebborn
🧾 The Proof of Process - INDICES 🎯 This is what happens when structure is followed Not predictions Evidence 📊 S&P 500 📊 NASDAQ 📊 RUSSELL 2000 📊 DOW JONES All mapped in advance - All delivered Targets called Targets respected Price delivered While most were uncertain and bearish The structure was already clear Markets don’t move randomly They move in phases 🟢 Allocation 🟠 Expansion 🔴 Distribution Indices have now transitioned If you’re seeing this now - you’re seeing the results Paid subscribers saw the process in real time Full FREE breakdown 👇🏻 moderndayelliottwave.substack.com/p/the-proof-of… This is Elliott Wave 2.0 Structure first Price confirms Patience wins
English

6. 90% of your meals should be: chicken, steak, beef, salmon, shrimp, greek yogurt, eggs, fruit, rice, veggies, and potatoes
7. Lift legs 2x per week minimum. Your body's biggest muscles are in your lower body.
English
After 9 years in the gym and helping over 900 people drop 20-80 pounds, here's every fitness tip I could come up with:
1. Stop drinking alcohol.
English

Cycles, the Moon and why being bearish now is a bad idea
If you want to stick to cycles, stick to moon cycles. Each "Lunar Eclipse Cycle" is made of three/four total eclipses pretty close to eachother (timewise). The last one marks the bottom or is very close to it. If you simply bought at every last Lunar Total Eclipse, you would be in a very good position.
The multiyear phases between those eclipse clusters are bullish.
The crazy part? The last total eclipse of the current cluster is on 3rd of March 2026. Just around the corner.
If this plays out again, we have a bullish phase in front of us all the way to Q3/Q4 2028!
Does not mean it explodes right away, but that we start getting moving (or ranging for a bit longer before moving).
The next Shmita year starts in September 2028. This is something the Bear Hitler (@ChifoiCristian) is vocal about. Which falls into place with Q3 2028.
And if that is not enough for you: If the ISM PMI is above 50 (or even higher than the current 52.6) in the next reading (data will be available next week), right at the end of the Lunar Cycle, after being surpressed for 3.5 years, you can cry as much as you want.
Matter of fact is: The business cycle is just getting started. One of many reasons, why the 4 year cycle is broken.
The credit spreads are fine for now. Other things are showing cracks. So there is still stress in the system. But that can change. And even if we get the crash I expect for this year, it will be short lived and only will accelerate the upside, because there will be no other option but fixing it with a bandaid, which is called Emergency Liquidity Injections.
h/t to @ChartingGuy , who is working with those kinds of correlations and applies them to charting and is vocal about it. You can call it crazy but ignoring it is limiting your abilities for no reason.
$BTC #bitcoin #moon #LunarEclipse

English

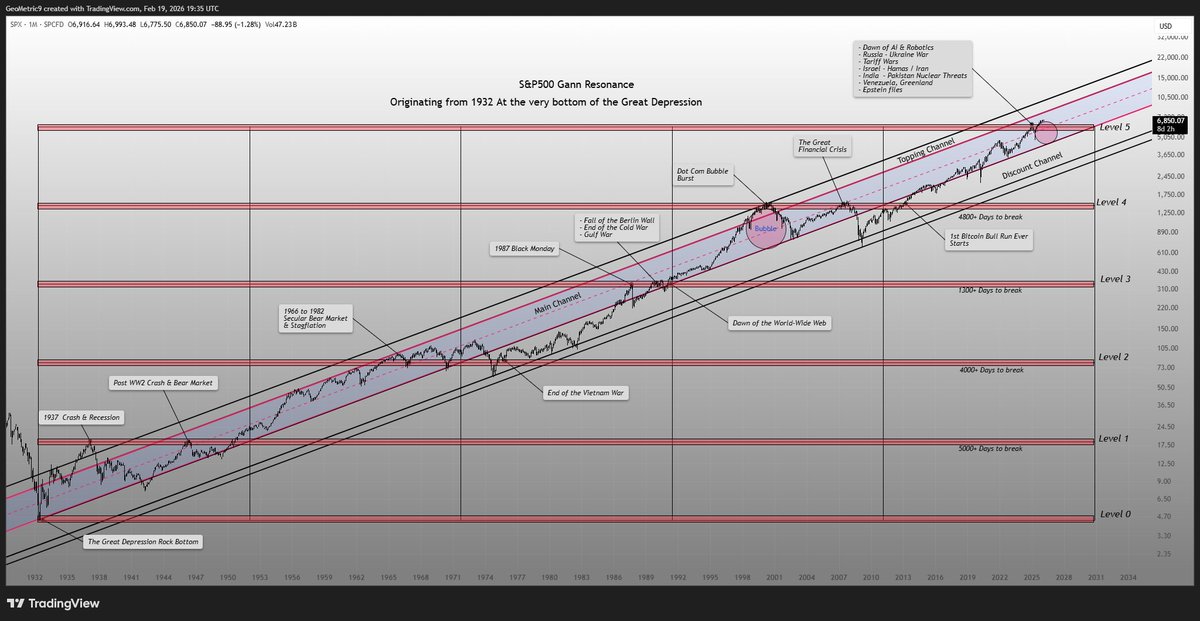
Should the S&P500 reach the Topping Channel, on this chart spanning almost a century, that will be an easy exit for me. This bull run was the quickest the $SPX broke through a horizontal Gann level in history. It does make sense for it to reach for the topping channel. We shall see.
It also makes sense in the short term, should it pullback from here, to hold level 5 as support. A loss of level 5 would likely mean a loss of the mid-line of the main channel. The mid-line itself has historically been a major support / resistance.
In it's history, it has never gone in reverse from one Gann level higher, to one Gann level lower.
Economic & Geo-Political turbulence has been a recurring feature when price reached these Gann levels. Several major recessions unfolded exactly as price reached these levels. It has been a relief so far to see the SPX cross and hold above Level 5.
English

Let's see if this first 5 wave move finishes before the weekend. Looks like we have 1-2 so far. #BTC
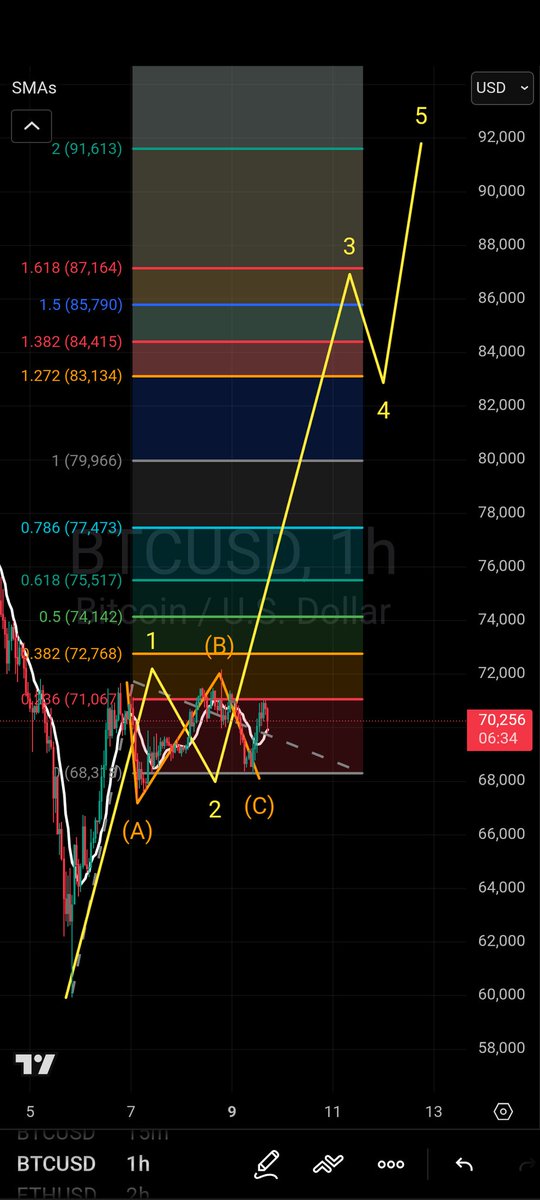
Andrew 🇨🇦@GoldnGuitars
Nice potential short-term long/short trades on #BTC 15 minute chart. Peak probably Tuesday, maybe Wednesday. Follow the structure for confirmation.
English
English

🎥 Webinar Replay Now Available: Equities are at all-time highs. Bitcoin is lagging. Why?
In our latest Global Macro & Bitcoin Market Briefing, @willywoo, @HenrikZeberg, and Yann Allemann break down:
• Why equities can surge while Bitcoin hesitates
• What liquidity vs. flows are really signaling
• Where we are in the cycle — and what comes next
🎥 Watch the full replay ↓
youtube.com/watch?v=FjTf9d…
📅 13.01.2025

YouTube

English
@lourenco_vs Likely, as Daily Cycle Low around Jan 20 according to @camelfinance
English

$BTC fakeouts
Yesterday I was entertaining the possibility of a fake out to the downside.
We broke above. We now need to be on the lookout for this not being a fakeout on the opposite direction.
For the breakout to hold, we should not be losing 94k.
Some possible excuses for volatility with the Market Structure Bill and the Supreme Court shenanigans.
BTC needs to show us where the real direction is gonna be to.

English
@WomanDefiner @_Checkmatey_ Sure thing. Just ask the native Indian population…
English

Most Americans will never realize just how much have been taken from them via immigration and foreign workers but its a lot. Everyone under the age of 50 has paid a drastic price to make foreigners dreams come true.
ICE of TikTok@ICEofTikTok
Construction company owner says he is seeing a difference ever since ICE has been in Louisiana. “No immigrants want to go to work … and it is so amazing. I’ve gotten more calls in the last week than I’ve gotten in the last 3 months.”
English
