
Droopy the Great 🧭
2.2K posts

@Oracle_Casper
“UP IS DOWN”? Well that's just maddeningly unhelpful. Why are these things never clear? 🔁


As 👁️ see it A recognizable bottom has NOT NOT NOT been completed in Bitcoin. A possible bear channel exists from the Feb low. Price is being repealed from the upper boundary. An ATR close below 79145 would indicate a retreat back to mid point, then maybe the lower boundary


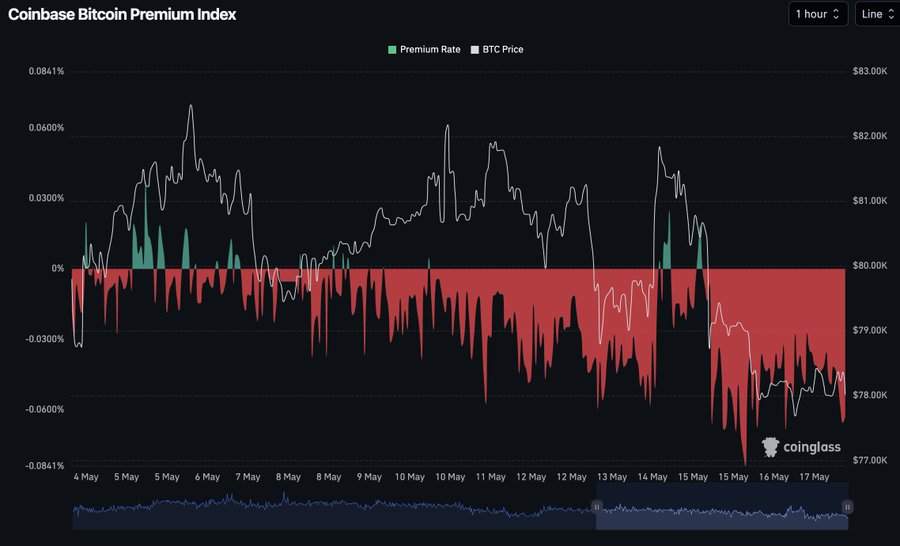
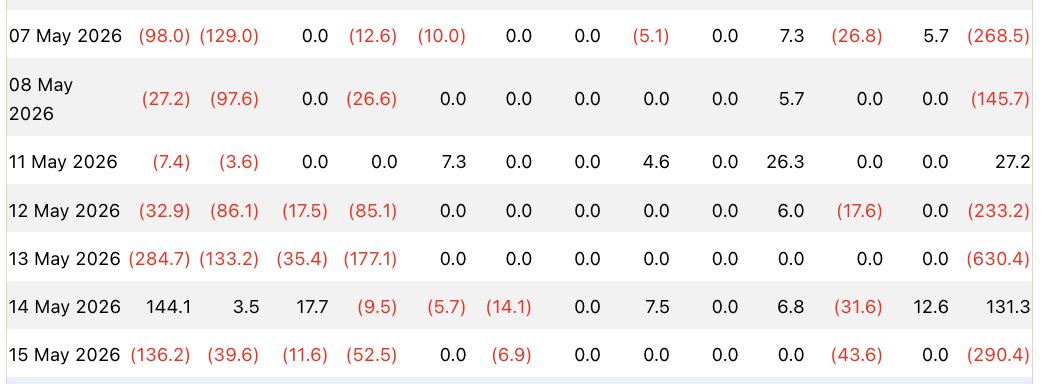
5 reasons crypto doesnt look great to me: 👉Unusual & large bearish LTF put positions hit the tape today for both $ETH and bitcoin:native with exp 5/29/26 for $500m ($135m notional for $ETH + $373m notional for bitcoin:native 👉$BTC ETF outflow has been significant for a week now since 5/6/26. Outflow today alone was $345m negating all STRC pre-dividend buying (which was low too btw) 👉$STRC raise has been anemic compared to prior months....and we are approaching ex dividend again where volumes/buying will be in decline after. (aka: Investors buy STRC before the 15th ex-dividend date → volumes spike → Strategy issues more shares → buys more BTC) 👉Coinbase premium has been negative since 4/27/26 👉We're entering a period of structural weakness in equities starting next week thru end of summer


🚨BREAKING: IRAN'S ISNA SAYS PARTS OF AXIOS REPORT ARE SPECULATION


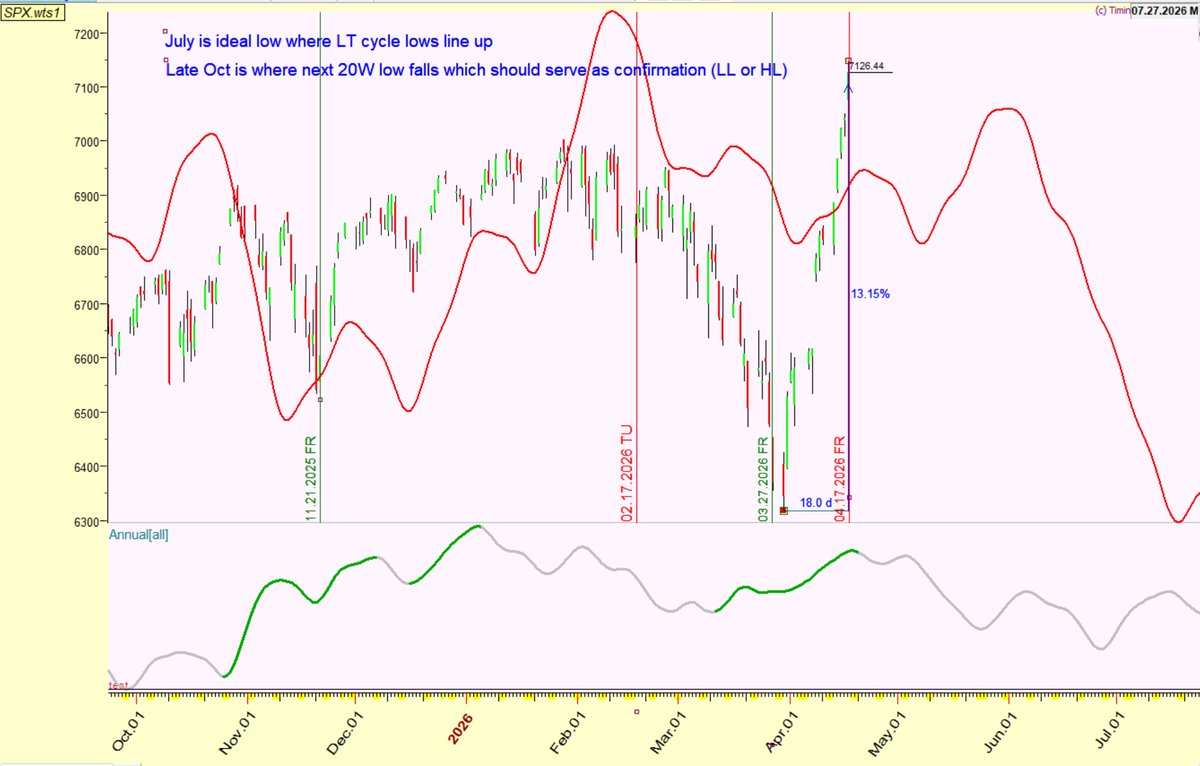
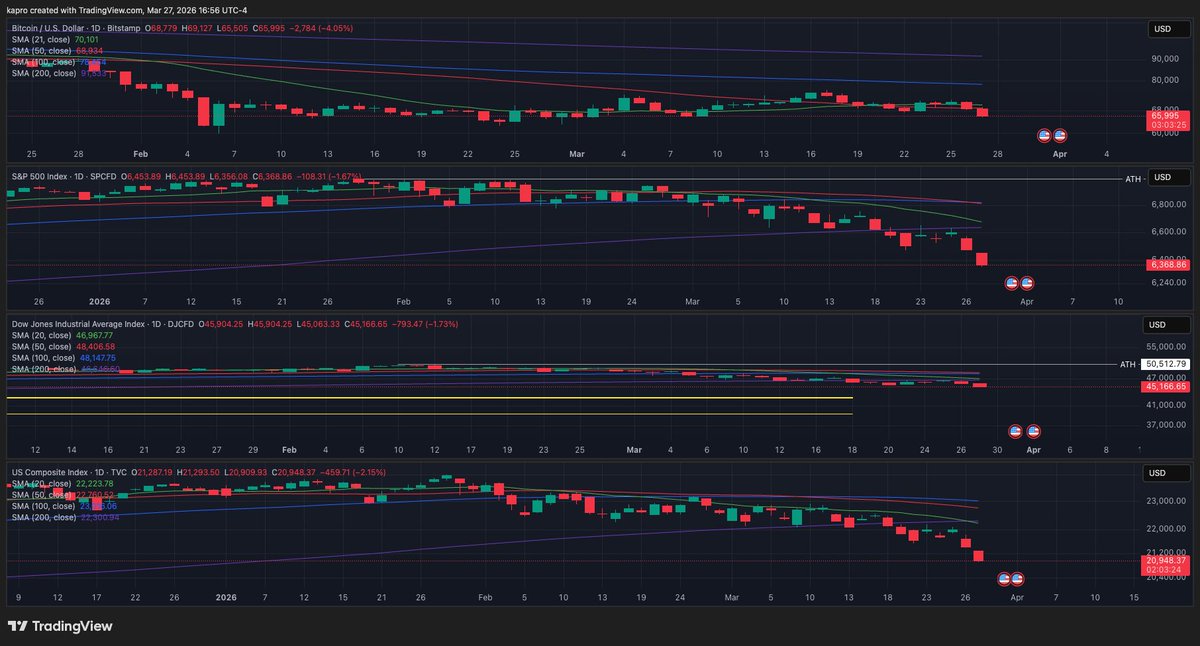
I’ve been waiting last few months for signs that 3.5 year cycle has topped. We’ve been buyers of dips as models were bullish. It has changed in Feb when I posted that I went mostly cash and now all models I track are now on a weekly sell signal / bear regime. -The last time we had a similar set up was Dec 2021 and we went defensive before the bear market which positioned us well to be buyers of stocks at bargain prices later in 2022. Now current 3.5Y cycle is peaking/rolling over - time to pay attention. -I don’t like playing Monday morning quarterback so I try to give you my actionable primary roadmap a few months out and adjust along the way based on cycles, models, technicals etc. Saying something was obvious after the fact doesn’t help anyone. -Below is my experimental $SPX composite leading indicator which I’ve been working on for several years combining various cross-asset signals. Not meant to perfectly time every micro move but can be used as a confluence for larger trend changes -In Dec ‘25 I saw upside headfake move (UTAD in Wyckoff terms) in Q1 2026 and then rollover; now with more data coming in it’s suggesting a bigger decline in Mar-Apr - in line cycles/ models / TA - $SPX is still only -3.4% below ATH so real correction hasn’t even started. When talking heads on CNBC start panicking it will be too late. Not trying to fear monger, just calling it what models are showing. Capital preservation is key. -I take time out of my weekend to post this to open people’s eyes to a potential significant downside in the market and consider contingency plans. If you find it helpful and want to get more updates - please retweet.

I know a bounce off of 106k makes the most sense but im not ruling out a move straight to 100 😆


This is absolutely CRAZY. Bitcoin is up 34% against gold since the US-Iran war started 23 days ago. BTC is the new safe-haven asset.