
Jarhead
3.2K posts
Jarhead
@PCPMarine
25yr+ Fintech Exec. and crypto will replace me. Don’t follow me, I don’t tweet. USMC 87-92
Earth Katılım Ağustos 2012
800 Takip Edilen90 Takipçiler

Crashes don't destroy wealth.
They transfer it.
From the scared to the prepared.
Every RSI <30 signal in history:
2020: QQQ up 400%
2022: QQQ up 300%
2025: QQQ up 550%
We're approaching that level again.
If you know how to use LEAPs right now, you have an unfair advantage over 99% of traders.
Comment "TRANSFER" and I'll send you my full LEAP strategy.
English


Who we are
Portfolio managers from the @SoJustFollowMe team
What we offer
Stratosphere is a Live Portfolio Access service:
• Real-time view of a live portfolio during the US trading session
• Personal notifications for every trade in the portfolio
What’s included in the notifications
• Ticker / instrument
• Strike price, expiration date, contract type (for options)
• Direction (long/short), action (buy/sell)
• Position size as % of AUM
• Entry price
Trading instruments
• ETFs tracking major indices and economic sectors
• Mega-Cap and Large-Cap stocks
• Options on all of the above
• Leveraged ETFs
Subscription options
• Quarterly: $350 USDT (to be announced)
• Annual: $1,000 USDT
Since the service is currently in launch / test mode, subscribers who join between March 15 - 22 (NY time) will receive the option of an unconditional full refund within 14 days of payment.
• Free 1-day trial (coming soon)
Next steps
If you are interested in becoming one of the first subscribers, then either:
1. Subscribe to this @X account and add a comment with “+” to this post, or
2. Send a direct chat message with “+”
This way we will be able to send you access instructions.

English

Tagging everyone who commented “Stratosphere” and asked to be notified. Part 2
@fmarsala, @CuriousTabby, @f8kpw8yxs6, @ThakkarPulin, @Iliaterwildwolf, @elschwet, @tweetandawe, @radalor2023, @ChynnHeaven, @Ram0567339005, @e8bd58d4a10f462, @Federic1234ABCD, @vin634398334250, @StefanDoleschel, @cs2024usa, @DLeyguarda, @martinmoehring, @JuanCar40406185,
@PCPMarine, @BiteSizeToothDr, @boozdog, @TRFletcher, @hawkeye_jd_ , @AristotelisLeo1, @brocks_3608, @corbettmark, @SaluteToGod, @Chocolate_0015, @HowieTan88, @TruDatBat, @JoeLai25595583, @OAlmond19651139, @rhymeswright, @Playing1Handed
English
My team and I are launching the public portfolio service STRATOSPHERE.
• AUM size – $150k
• trade structure – so that trades fit almost any account size
• underlying assets – indices, economic sectors, large-capitalization companies
• main instruments – call options and leveraged ETFs
• trading time – regular trading session from 9:30 to 16:00 NY time
Every action in the portfolio – you’ll receive an individual notification shortly.
Portfolio viewing will be available online every trading day from 9:00 to 16:30 NY time.
Who is this service for?
That is a question each of you will have to answer for yourself – only you can assess your experience, your approach to trading, your discipline, your trading strategy or its absence, and only you know your trading history and its real results.
What can be said for sure: if you
• close every year in profit, year after year outperforming $SPX
• are a committed supporter of holding positions through red
• are convinced that you can consistently make money with a portfolio consisting entirely of “undervalued” companies like $MSTR, $PYPL, $JD, $EL, $SMCI, $SNAP, $PATH, $DUOL, $HIMS, $OPEN, etc.
• trade earnings, news, IPOs, SPACs and other random events
• are a fan of shorts, hedging and other strategies with a low probability of success over long periods of time
• firmly believe that you can perform the work of an open-heart cardiac surgeon after studying information on @X written by a theatre student
This service is definitely not for you.
p.s. The service is anonymous. Neither we nor other clients will be able to know that you use it unless you disclose this information yourself.
Want to know more? Go to @StratosphereBot
What are the principles behind the strategy? Posts below show how I think and trade.
🟢 Must reads
🔵 Good to know
THE BASIS OF MY STRATEGY
🟢 Deliberate Aggression → Absolute Control
x.com/sojustfollowme…
🟢 How I differ from 99.99% of traders
x.com/sojustfollowme…
🟢 How I structure my portfolio
x.com/sojustfollowme…
🟢 Predict Indicator: Red or Green Days Ahead
x.com/sojustfollowme…
🟢 My Trading Evolution: From Imitation to Independence
x.com/sojustfollowme…
🟢 Why I Trade Only the U.S. Market
x.com/sojustfollowme…
🟢 Why I Don’t Hedge (and Stanley Druckenmiller too)
x.com/sojustfollowme…
🟢 Why I Rarely Use Short Positions
x.com/sojustfollowme…
🟢 Answers to questions about my trading strategy. Part one
x.com/sojustfollowme…
🟢 Answers to questions about my trading strategy. Part two
x.com/sojustfollowme…
🟢 Important note
x.com/sojustfollowme…
WHY I TRACK TRADING ALGOS
🟢 Power, Media, Money: Algos Against You
x.com/sojustfollowme…
🟢 Brokers in suits are out – AI runs Wall Street now
x.com/sojustfollowme…
🟢 News and “accidents”… not so accidental after all?
x.com/sojustfollowme…
🟢 Jeffrey Epstein on Wall Street
x.com/sojustfollowme…
🟢 Visible trading algos shifts from New Year
x.com/sojustfollowme…
WALL STREET: BRUTAL REALITY
🟢 All you need to know about Wall Street hedge funds. Q4 2025
x.com/sojustfollowme…
🟢 Mutual & Hedge Funds: 2025 Disaster, Déjà Vu
x.com/sojustfollowme…
🟢 All you need to know about Wall Street hedge funds. Q3 2025
x.com/sojustfollowme…
🟢 All you need to know about Wall Street hedge funds. Q2 2025
x.com/sojustfollowme…
🟢 Everything You Need to Know About U.S. Hedge Funds – in a Single Brutal Chart. Q1 2025
x.com/sojustfollowme…
WHY I THINK WE’RE MORE LIKELY HEADING FOR THE COLLAPSE OF THE AI BUBBLE
🟢 The collapse of the AI bubble. Part one SPX/M2SL
x.com/sojustfollowme…
🟢 The collapse of the AI bubble. Part two SPX/M2SL
x.com/sojustfollowme…
🟢 The collapse of the AI bubble. Part three QQQ/M2SL
x.com/sojustfollowme…
🟢 $MSTR: SEC, fraud, crash -62% in one day
x.com/sojustfollowme…
🟢 IMF in panic? Reading between the lines
x.com/sojustfollowme…
Continued ↓

Denistratos@SoJustFollowMe
🚨 THE COLLAPSE OF THE AI BUBBLE. PART ONE – INTRODUCTORY. In his 1886 work “Beyond Good and Evil,” Friedrich Nietzsche wrote: “…if you gaze long into an abyss, the abyss also gazes into you.” Well, Mr. @michaeljburry seems to have stared deep into the market’s abyss – and spotted an AI bubble staring back. The problem is, this poor Cassandra’s predictions have been missing the mark for years. Fair enough – the existence of an AI bubble is obvious to almost everyone (except a few completely delusional individuals). But when it bursts, and what to do next – he doesn’t know. I do. Before you is one of the small fragments of my trading system: SPX/M2SL – an indicator showing the ratio of the S&P 500 to the M2 money supply (seasonally adjusted). In essence, it’s a measure of the total amount of money available in the U.S. economy. What’s important to know? This exact indicator gave me the signal to move 100% to cash: ▫️ in 2018 – before Trump Tariffs 1.0 and the start of the trade war with China ▫️ in early January 2020 – before COVID-19 ▫️ in December 2021 – before the 2022 Bear Market These and other introductory key dates are marked on the chart. Observe, study, verify. Words here are basically unnecessary. Part Two – the practical one – is planned to drop tomorrow. But whether it actually comes out depends entirely on you. I won’t post it until this one gets 35 likes and 35 comments. Or 100 likes. Not a single one less. p.s. Charts posted by @Barchart under titles like “Tech Stocks relative to M2 Money Supply 🚨 Dot Com Bubble vs. Now 🤯👀” are absolutely useless and uninformative. Same goes for all other M2 Money Supply “variations.” See for yourself 👇🏻👀 p.p.s. On the chart, you’ll see what looks like SPX/M2SL touching its lower boundary – but in reality, there was no touch‼️ • I expanded the range and only noticed after the chart was finalized – and didn’t bother redoing it, since it makes no difference for the introductory part; • The chart was prepared earlier this week, and with the market correction, the indicator itself also adjusted slightly – moving away from that “touch.” Future updates (if there are any) will be published without this error. $SPY, $QQQ, $MAGS, $SMH, $NVDA, $MSFT, $AAPL, $GOOGL, $AMZN, $META, $TSLA, $AVGO, $ORCL, $PLTR, $AMD, $NFLX, $ANET, $CRWV, $NBIS, $HOOD, $SOFI
English

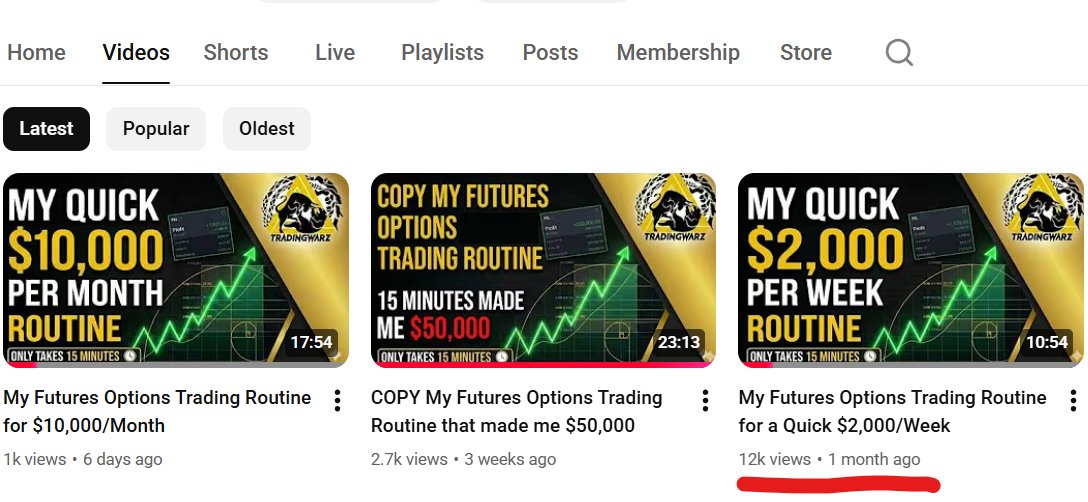
BREAKING: This is how I make 10k/month with over 95% Win Rate SELLING OPTIONS STEP BY STEP!
Now over 84k gains in 1 year and grew my account over 8 figures!
My FULL Options SELLING COURSE from Beginner to PRO $SPY $TSLA $NVDA $AMD
To celebrate I will also throw in my CHECKLIST and Indicators
Just comment "ME" and DROP A 👍for ME
English

BREAKING: I am BLOWN AWAY by the support here you go
My FULL Options SELLING COURSE from Beginner to PRO $SPY $TSLA $NVDA $AMD
This is how I made 80k with over 95% Win Rate in 1 year STEP BY STEP! Now over 8 figures
To celebrate I will also throw in my CHECKLIST and Indicators
Just comment "ME" and DROP A 👍for ME!
Trading Warz@TradingWarz
Options on the SP500 changed my life I sold over 1250 puts all expiring worthless and then I add leaps for huge multi baggers I spend 15 minutes per week on sunday night futures selling strangles for the week and ive generated over 81k with 95% win rate The dark secret in the market is they want retail to chase 0 dte and OTM where the big boys are selling it! Im starting a new small and large account challenge this year where i will teach you step by step in real time I will be making videos on YouTube and doing spaces all NO CHARGE
English
BREAKING: My SP500 OPTIONS Selling Trading University Completed (COPY ME)
5 Courses + Scanners + Indicators NO CHARGE
Comment " ME " and I will sent it directly on your DM

English

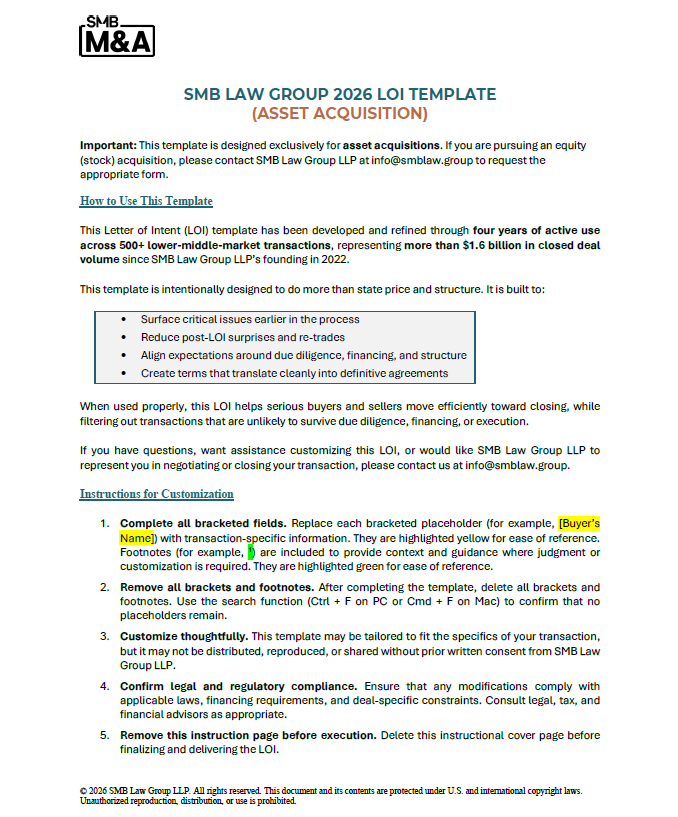
We just released our 2026 Lower-Middle-Market LOI Template.
Built from:
> 500+ deals
> $1.6B+ closed
> And the busted ones
It’s designed to reduce retrades and increase close probability.
If you want the template, comment:
LOI
We’ll auto-DM you the download link.
We’re on a mission to build the #1 LMM M&A firm and the #1 provider of value in the space.
English
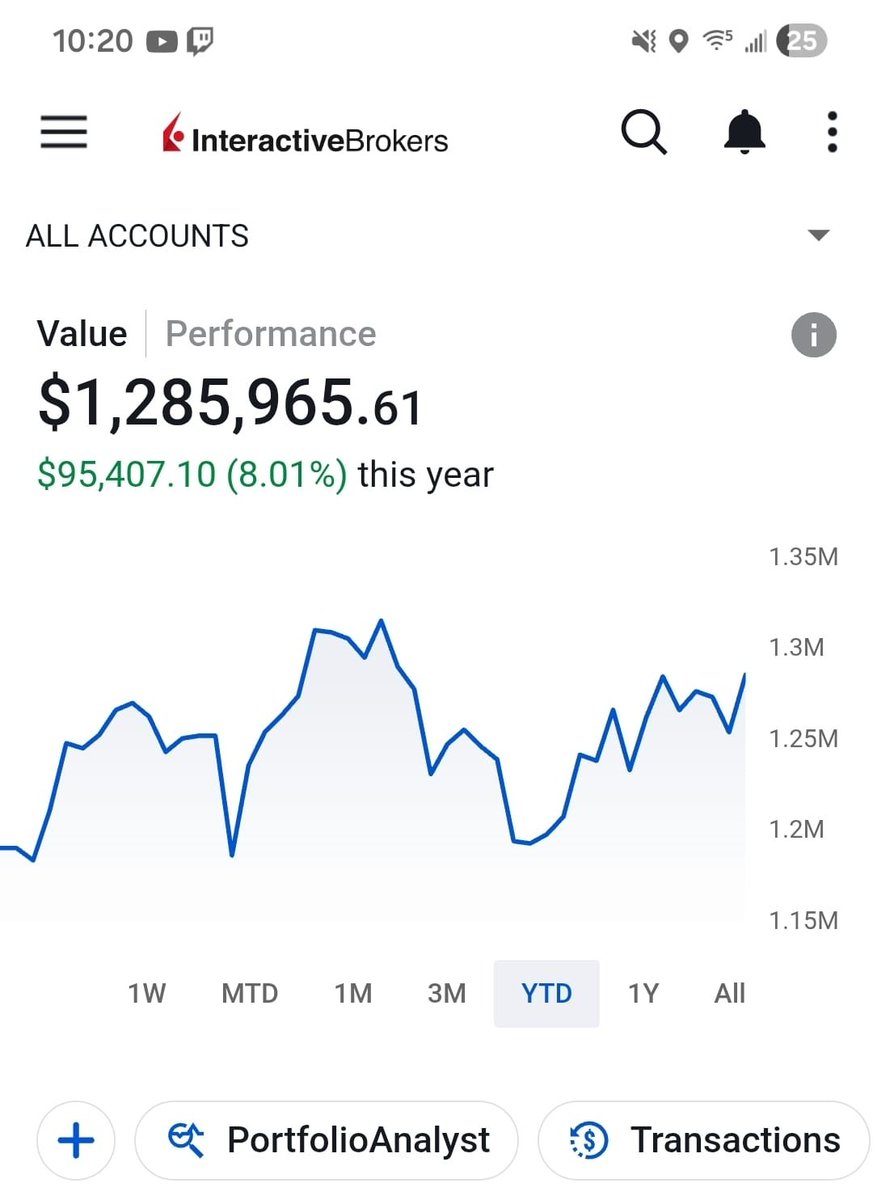
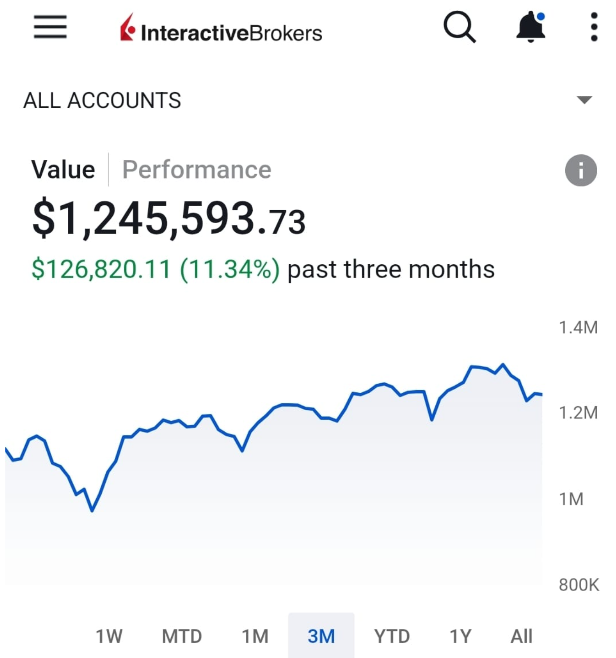
$873k in realized profits (screenshots in Highlights) or 70%+ YTD return from June to December 2025 in the public portfolio.
I made this with full transparency – every trade from entry to exit, every position change, daily P&L.
For new followers – who’s behind this account:
Greek, 44. @MIT grad. 21 years in the markets.
Former Chief Investment Officer & Head Portfolio Manager on Wall Street.
I managed a portfolio with ten-figure AUM and delivered a 44.7% CAGR over the last 7 years.
I am currently serving in the same capacity at a hedge fund in Abu Dhabi, UAE.
My edge is a trading system inspired by Jim Simons’ Medallion & Renaissance approach.
I design and operate mathematical market system.
Running since 2019 – green every single year, consistent outperformance vs #SPX, with superior drawdown, recovery, Sharpe and Sortino ratios.
In the coming days, my team and I are launching a new project. Want to be notified first? Leave a comment: “Stratosphere”.
In the meantime, below are the key posts I’ve written over the past 10 months on @X – they show how I think and trade.
🟢 Priority reads
🔵 Secondary reads
The Basis of My Strategy. Read below ↓

English
⚠️ Thank you all for your concern and messages of support.
Yesterday, based on indirect signals about how the situation could develop, I decided to leave Abu Dhabi with my children and my team. For the same reason, I closed part of my portfolio positions.
We are safe now.
I have a clear, non-emotional view on what is happening, but due to my employment agreement, I cannot comment on geopolitics and will leave it at that.
English

LEAPs explained in 60 seconds:
A LEAP is a call option with 1+ year until expiration.
You control 100 shares of upside for a fraction of the cost of buying them outright.
Why I use them:
- Leveraged exposure on stocks I already have deep conviction in
- 12+ months for the thesis to play out
- Long-term capital gains tax treatment if held over a year
- Less capital at risk per position
Why most people lose money on them:
- They treat them like lottery tickets instead of investments
- They skip the research and chase cheap contracts
- They don't have a framework for when to enter or exit
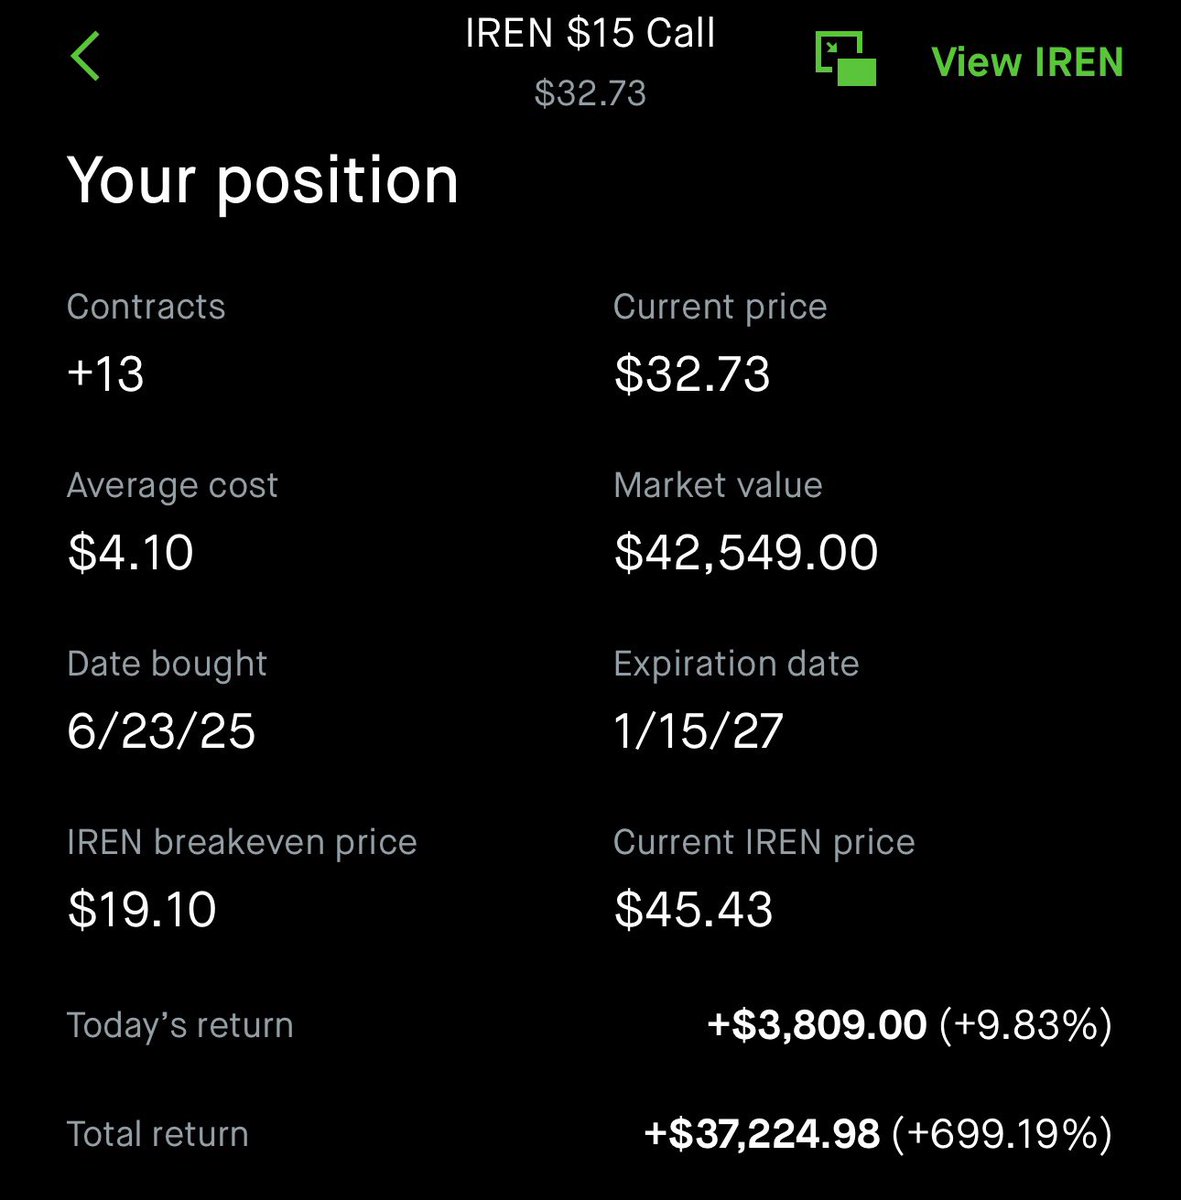
I've used LEAPs to make hundreds of thousands of dollars on names like $NVDA, $HOOD, and $IREN. The difference wasn't luck - it was having a repeatable process for picking the right stock, the right strike, and the right time.
Comment "LEAP" and I'll send you my free cheat sheet on how I evaluate every LEAP trade.
English
BREAKING: My OPTIONS Selling SP500 Trading University Completed
5 Courses + Scanners + Indicators NO CHARGE
Comment " ME " and I will sent it directly on your DM


English

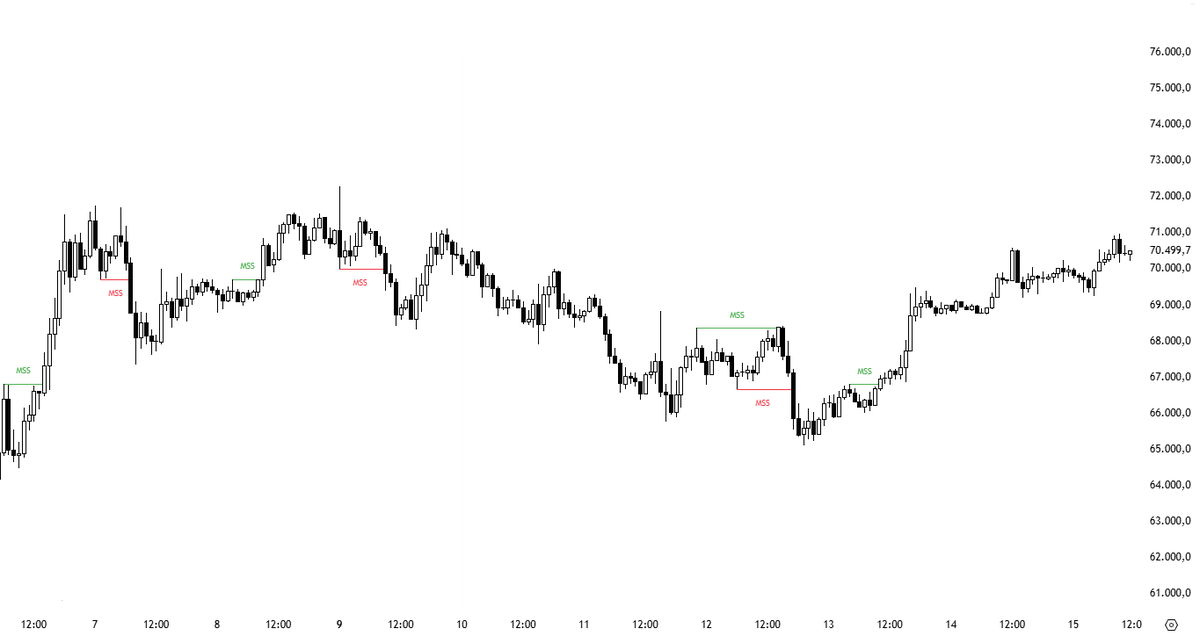
I'm releasing 3 new indicators in 48h
1. Market Structure
2. FVG and IFVG
3. Liquidity Sweep
They're free
Who wants them?

English
BREAKING: My OPTIONS Selling Trading University Completed
5 Courses + Scanners + Indicators NO CHARGE
Comment " ME " and I will sent it directly on your DM
English

Talked to a trader who's made almost $1,000,000 in the last 24 months...
Over $400,000 last year alone.
Asked him what his A+ setup is.
The one he's locked in on every single day.
"When I see it, I know exactly how it plays out."
12 years of trading.
Every strategy, indicator, and system you can imagine.
And he keeps coming back to one setup.
One area on the chart where he makes his money.
He calls it "The Battle Zone."
The place where most traders panic.
Where emotions run highest.
Where the money actually changes hands.
But knowing when to trade is only half of it.
He also created something called the "No Trade Zone."
The area on the chart where he refuses to trade.
Doesn't matter how bored he is.
Doesn't matter if everyone else is trading.
If price is stuck there by noon... he walks away.
No trade. No forcing. No exceptions.
That discipline alone separates him from 90% of traders.
While they're overtrading and bleeding out...
He's waiting.
And when his setup finally shows up?
He's coming up off his seat.
"Oh here we go. This is exactly what I need to see."
Simple?
Yes.
Easy?
Not even close.
But $400K this year says it works.
--
Who wants his complete playbook/strategy + real trade examples?
We'll send it to your DMs — just reply "ME" 👇
English
@OnChainWizard - USDT held its peg and you earn 18% in Pendle loops while the 3,3 bets like OHM and Wonderland are rock solid plays that’ll never rug.
English

- you wake up
- it was all a dream
- LUNA is still at $80
- SBF and FTX are alive and well
- the Arbitrum airdrop is about to launch
- life is calm
English
Should read while scuba diving. A breath at the surface followed by a free dive and back to surface isn’t the issue as the air in the lungs contracts with the depth of the free dive and expands on ascent but volume doesn’t exceed original breath. When diving and the danger is a breath taken in via scuba at depth. If Something such as malfunction or out of air were to happen and the diver were to panic and rush to surface the breath taken at depth will expand and exceed lung capacity while acsending causing a rupture. Hence the scuba lesson: always be breathing, on said emergency ascent you must be exhaling on the way up so expanding air can be released. ‘Blow bubbles on the way up’
English

A simple test showing the danger of holding breath while diving
English
@Sandybestdog @financedystop Gotta call BS. Tell the Dr cash and they charge $250. Tell the Dr insurance and they charge $1000 of which insurance pays Dr $600 and Dr bills you $400 that the insurance didn’t pay
English

@financedystop I don’t understand what she’s saying. Cash customer pays $250, but insurance charges $1000. I thought Insurance is the one paying the doctor? Who is insurance charging and who pays it? Makes no sense.
English

This doctor, who owns her own private practice, shares how much advanced tests like MRIs, CT, Cardiac Stress Testing actually cost
English
Want to double your option premium without doubling your risk?
Use leveraged ETFs.
Instead of:
• TSLA (IV 57%) → sell puts for 5% monthly
Do this:
• TSLL (IV 90%) → sell puts for 10% monthly
Same underlying. Double the premium.
My favorites:
• SOXL (semiconductors 3x)
• TQQQ (Nasdaq 3x)
• TSLL (Tesla 2x)
• TNA (small cap 3x)
More premium = faster account growth.
DM "SYSTEM" for my 10-step PDF
English