
Summitwest IR
167 posts

Summitwest IR
@RaquelDanielleG
SUMMITWEST MANAGEMENT LTD U.S.RIA firm focused on global asset management and wealthsuccession
Katılım Ocak 2013
36 Takip Edilen9 Takipçiler

In June 2025, our Stock Waves analyst @ZacMannes mapped a precise bearish path for Asana $ASAN with a specific price target. Nine months and a 57 percent decline later, that target remains unchanged — and the structure suggests the final chapter has not yet unfolded. elliottwavetrader.net/p/analysis/Wha…
English

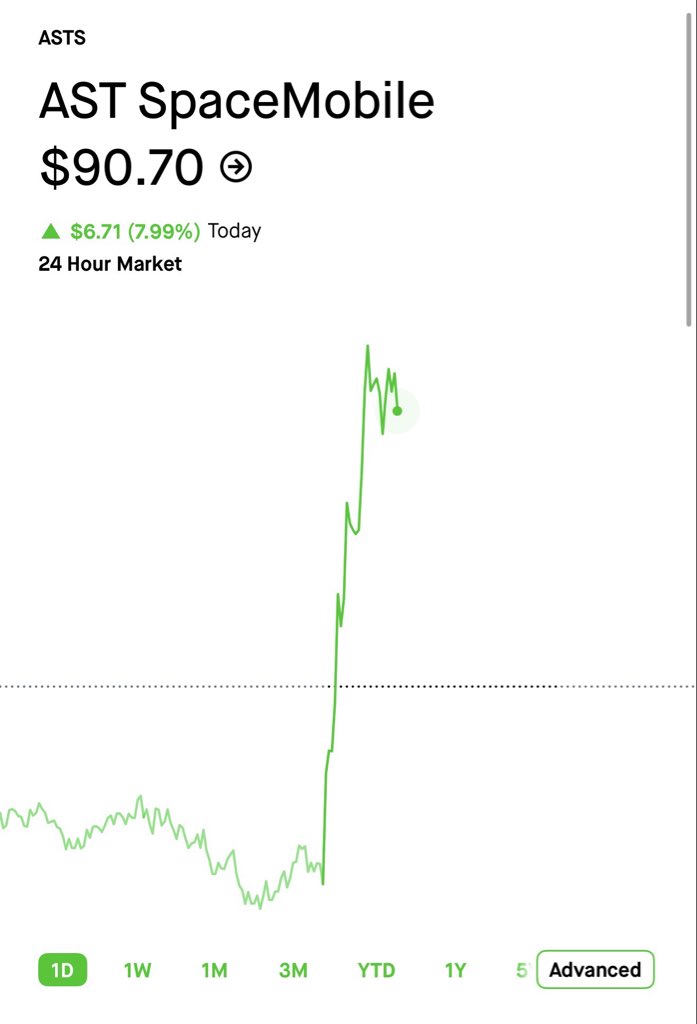
I think $ASTS will be back at ATHs in no time with its current catalyst.
Space X IPO near
BB7 Launch
Next launch batch.
Only seems right we go back to 130
English

$MRNA reclaimed the 3/3 swing low and moved back into range on solid green volume. Bull flag is now taking shape. Big money flowed into $XBI yesterday. While MRNA is currently lagging, it looks primed for a catch-up trade. Watching for the breakout.


English

FLY hissesi, İran savaşı başladıktan itibaren %40’a yakın bir yükseliş yaptı. Son 1 hafta içinde yaşanan düşüşü ise bugün geri aldı.
Bu tarz price action açıkçası hoşuma gidiyor. Güçlü hisseler, zayıf günlerde düşer ama hızlı toparlar.
Kısacası: Talep net, alıcı iştahlı.
Yatırım tavsiyesi değildir.
#borsa #yatırım #stockmarket #trading #analiz #hisse #momentum

Türkçe

If you’re new to following me or any #TheStrat trader:
We post setups that meet specific criteria, not predictions.
The focus is on understanding the actionable signals, confirmation, and market structure we trade around.
When a setup is posted, it’s not a claim about what will happen — it’s an If / Then framework showing what price can create, negate, or do.
Price Discovery
English


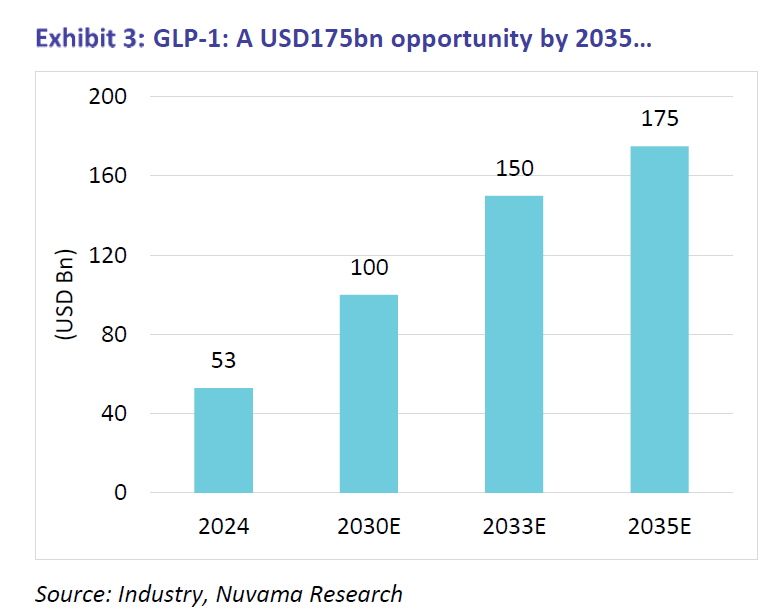
GLP-1 market is expected grow 3x in next 10 years.
Don’t make light of it:
i) Eli Lilly can emerge as a leader in the GLP-1 market due to its promising novel GLP-1 pipeline.
ii) Access to masses is still limited; hence, oral and generic GLP-1s are critical for global access.
iii) GLP-1 manufacturing is at least a decade-long opportunity for CDMOs.
Credits: Nuvama
English
@nirajtanna @CaVivekkhatri @iManasArora @Jagadeesh0203 @nakulvibhor @ValueIn84502221 @Vivek_Investor @Chart_Wallah108 @MarketScientist @_ChartWizard_ @ChartShala @Mr_Chartist @Portfolio_Bull @SamirPradhann @TheThevaluetrad @Vismaya9999 @STOCKBAGGER1 @Stock_Precision @kushthakkar183 Hello, want to collab with u
English

I am back on Youtube with weekly videos! A new one dropped just 2 hours ago. You can expect more action from me on Twitter as well - my social media break is over :)
youtube.com/watch?v=iojicu…
YouTube
English

TARGET 1 👍 : 11 HITS ✅ ✨
TSL TO 8 COST
HOLD FOR 17
#SYNGENE 420 CE
8 TO 11 | GAINS : ₹ 3000 / LOT [+37.5%] 💰
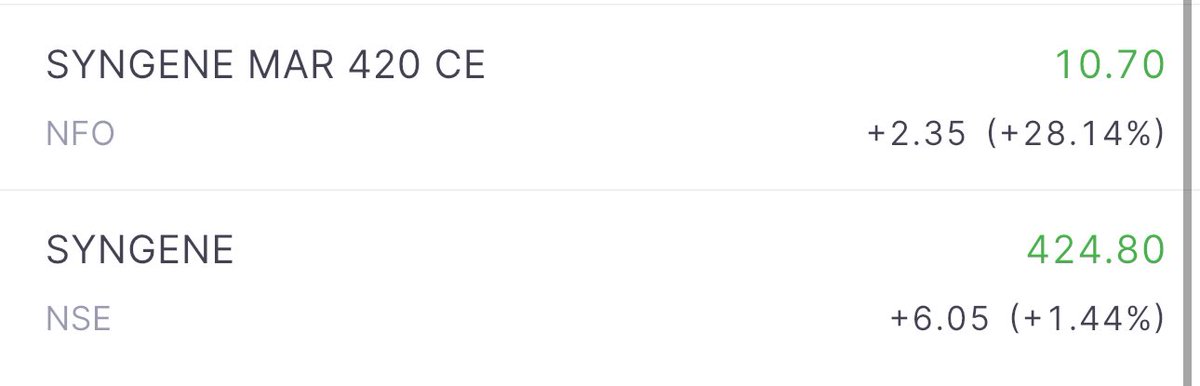
The Chartians@chartians
BUY #SYNGENE 420 CE MARCH CMP 7/9 SL 5 TGT : 11/17/25+
English


Get my newsletter tomorrow for my latest updates on names like $SNDK $NVDA $PLTR $GOOGL $META:
🍎 t3live.com/rd
English

American Dream Trading has the best trainers, best traders, the most profitable community, best apps, best strategies, the highest rated, and one of the most successful startups in US history. Why are you with anyone else? The choice is simple.
English

Another solid week of Stage 2 breakouts is taking shape this week but the overall market continues to put a damper on things.
There's potential for a good close to the week in the major indices though which would change the overall picture.
English

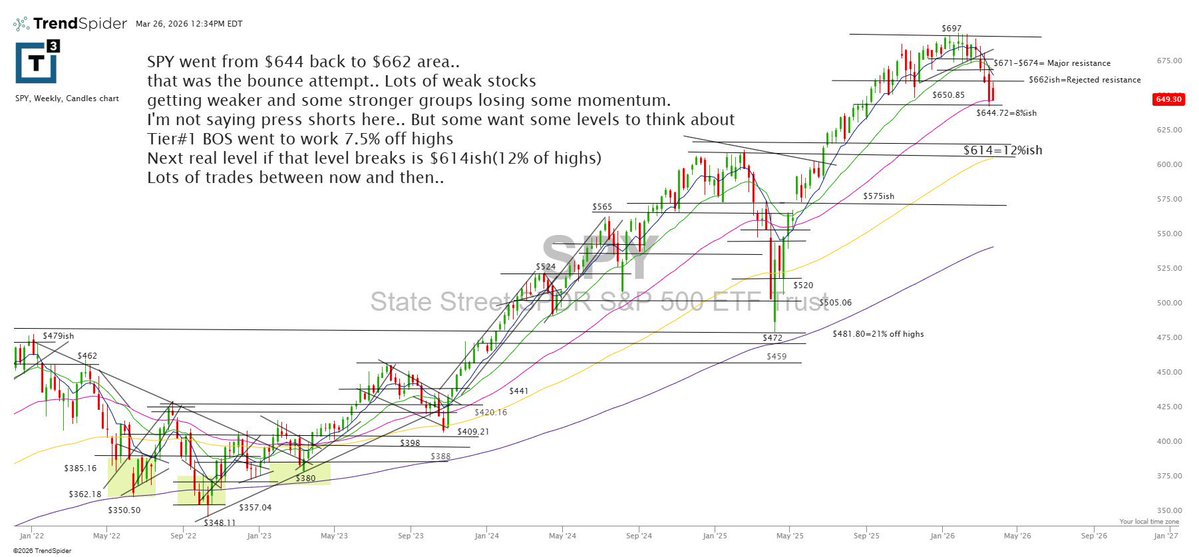
$SPX $SPY
2026 Stock Market Playbook
First and foremost, this should be an article, and eventually will be, but a few weeks ago I was alluding that PMs were topping at the end of January; I was writing an article to illustrate this, then they blew off and I just never came back to the article. Shame. But I’ll eventually write both as there is still value.
Back to the topic at hand, quick thoughts are as follows:
1. 99th percentile dispersion between single stock vol and index level vol as the AI grim reaper roams sector to sector, this is pronounced by record low cash levels as the “debasement / USD to zero” narratives have made investors allergic to including cash as a part of their portfolios (rotations!!). However, puts are relatively bid which is shown by current skew levels (downside vol is more expensive than upside vol by a fair amount). So no cash, but people are cognizant of the downside risks (hedging via puts)…
2. Indexes look the same they did in Q1 2025, and sentiment isn’t great, which leads people to believe we can’t realize any substantial downside moves. Every second post is the liberation day fractal, I get it.
3. This leads me to believe that this year will resemble 2022, not 2025 where we saw a sharp policy induced correction and subsequent V-reversal. Today’s market aligns with the previous mid-term year which also featured underperforming hedges (vol-exposed) despite the indices meaningfully grinding lower.
4. An important factor is the liquidity cycle, which I warned was topping back in October. What BTC and speculative equity sectors have done since this time only confirm that these worries were correct. Warsh and his fed balance sheet views will play a role in this.
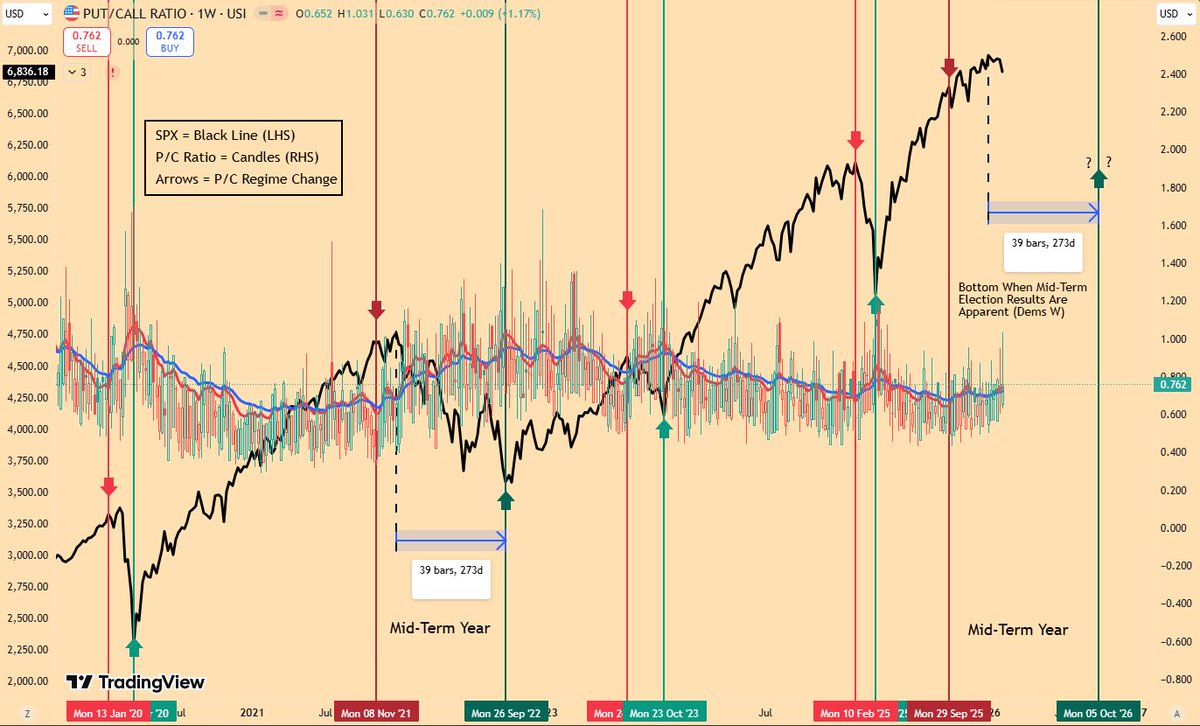
Now to the charts… take a few minutes to sink your teeth into these:
Chart 1— clearly depicts Put-Call regimes: when trending up, expect the index to realize downside volatility. Somewhat of a coincident indicator, but it has flipped and we haven’t seen anything substantial to the downside yet. And no, it’s not necessarily bullish that puts are getting bid, this can catalyze a negative gamma regime and amplify downside moves into $6600.
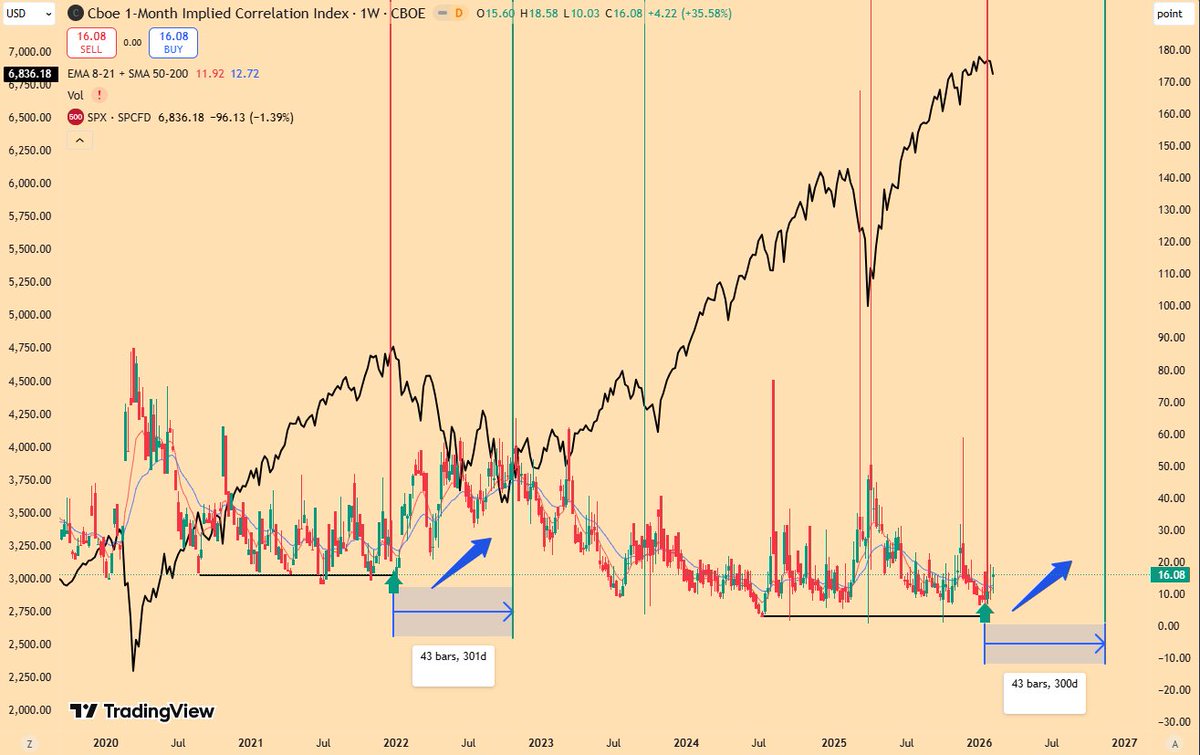
Chart 2— implied correlations has been undergoing the same 1.5 year bottoming process as it did into the 2022 bear market. I expect correlations are bottoming out for the rest of 2026; the chart is quite self-explanatory as to what occurs when this trends up…
TLDR: we’re likely moderately lower by the Fall, but you can’t stay max allocated and autopilot a 6-12 month put hedge and think you’re safe, it won’t work. You will need to trade around smaller intra-year vol events, buy the dip and sell the rip. You need to be a very skillful trader in 2026 if you plan to monetize any bearish views, otherwise just run higher cash and stay long your best ideas (there will still be plenty of winners on the long side this year, but it’s a stock picker’s market).
Please hold me to putting this in article form. These are two charts that I will be using as a template for 2026 (but there’s about 10 more I can provide to support my thesis).
English

$MU now trading below 4x earnings 😳

Shay Boloor@StockSavvyShay
AI SEMIS KEEPING THE MOST OF EVERY DOLLAR Operating margin breakdown: • Best-in-class (50%+) | $NVDA, $TSM • Elite (40–49%) | $MU, $ANET, $KLAC, $AVGO • Strong (30–39%) | $ASML, $TXN, $LRCX, $CRDO • Solid (10–29%) | $CDNS, $AMAT, $ALAB, $ARM, $MRVL, $SNPS, $AMD • Low margin (Below 10%) | $COHR, $LITE, $ON
English

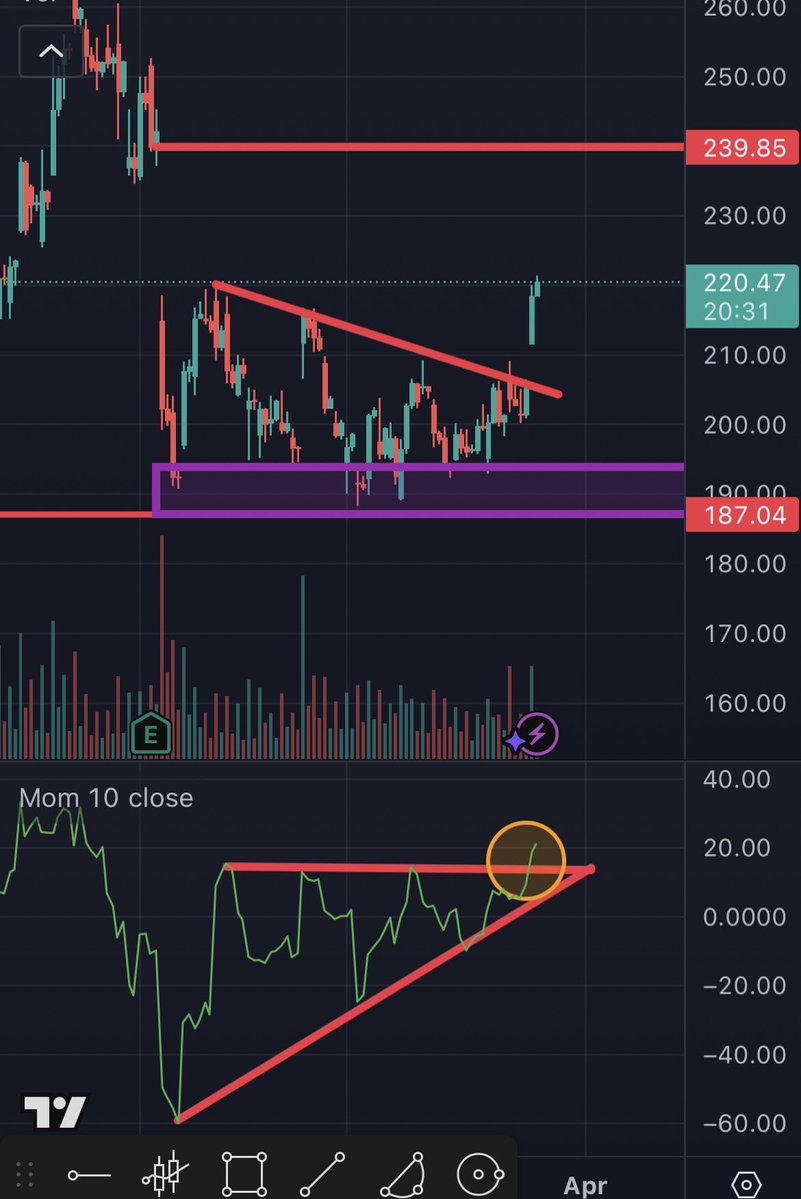
$AMD Breakout of momentum and price consolidation.
Top of gap $240.
English

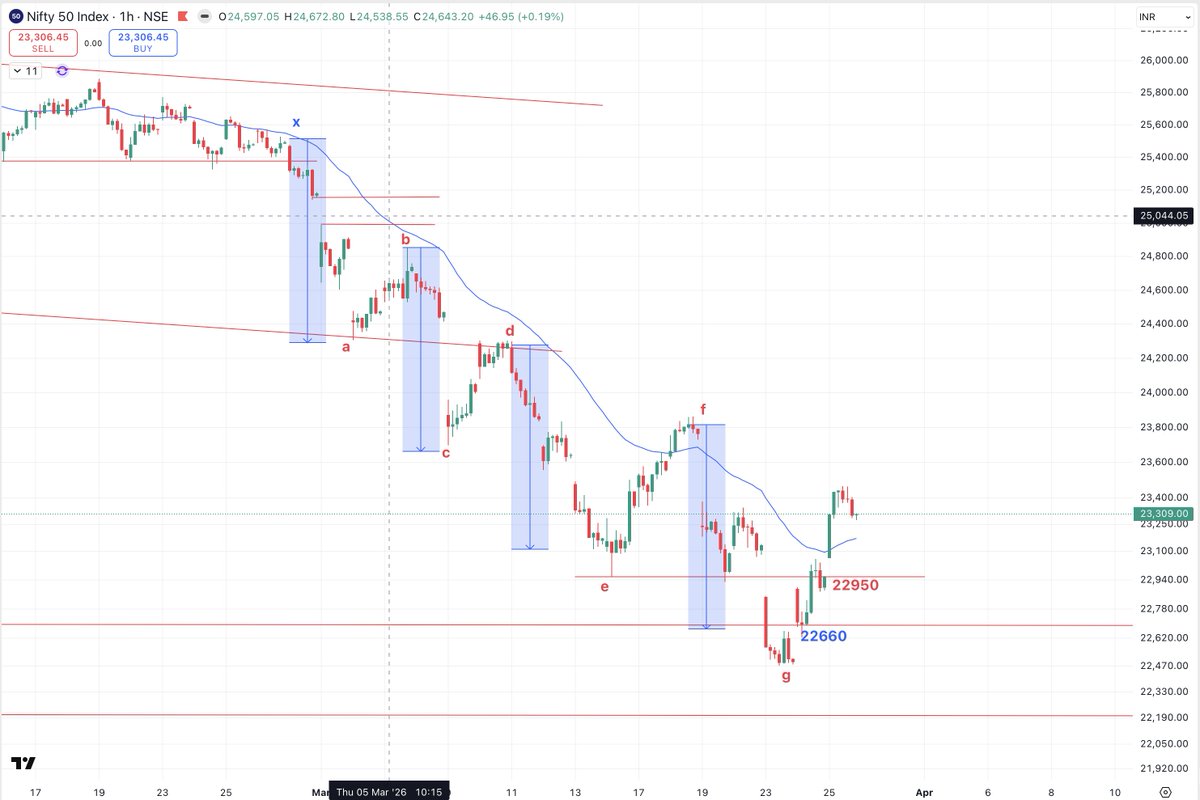
#Nifty completed wave g precisely as per equality target, retraced last falling segment in faster time, confirms short term low in place as long as 22950 is intact, morning tweet on buy above 23040 for 23300 or higher worked like magic, low at 23063 with 400+ move intraday
English