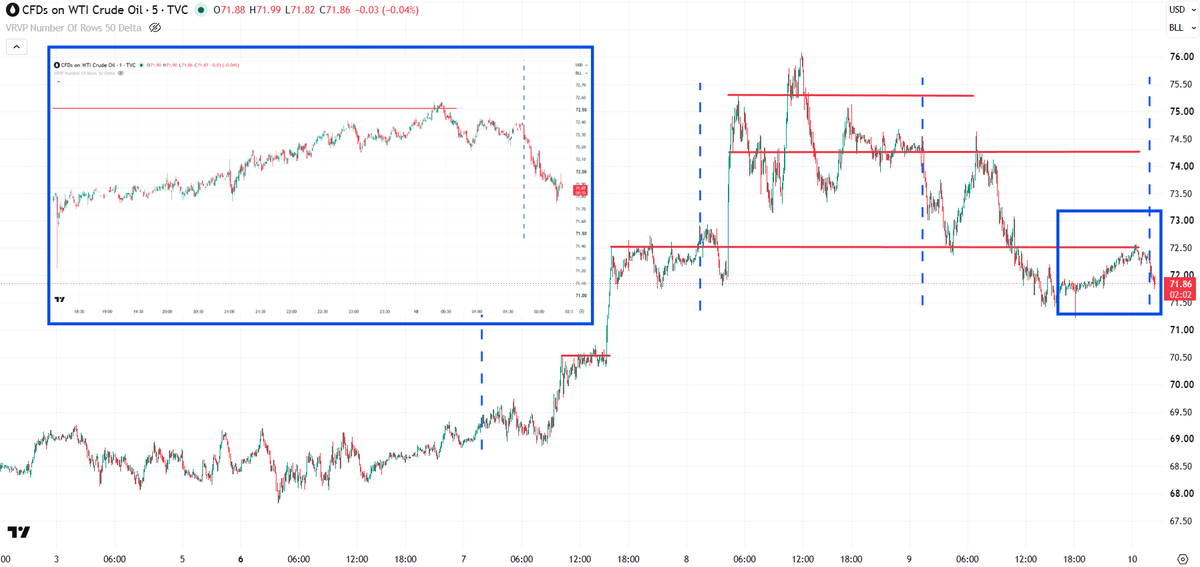
@FirstSquawk Everyone trying to unload their bags on the US market 😂
English
PermaTechBull
481 posts


WTI crossed $100 on March 27. The clock is ticking. $100 oil isn't the signal. $100 oil for 30+ days is. We analyzed every trading day WTI spent above $100 since 2003. 547 days. Then measured SPY forward returns at each duration threshold. The results are statistically significant at P < 0.0001 across 7 of 8 tests. What we found: SPY forward returns deteriorate monotonically the longer oil stays above $100. The market can absorb a spike. What it can't absorb is sustained pressure. The numbers: → ≥1 day above $100: SPY 10d return -0.28% → ≥30 days: -0.54% (win rate drops below 50%) → ≥50 days: -1.33% → ≥100 days: -1.40% (10d), -6.86% (20d) → ≥120 days: -3.81% (10d), -13.43% (20d), 0% win rate The baseline SPY 10d return is +0.38%. At ≥30 days above $100, that flips negative and never recovers. This isn't a round-number artifact. The same duration-dependent decay appears at $90 and $110. It's a fundamental relationship. Sustained high oil acts as a margin tax on the entire economy, and the market has a tolerance window of roughly 30 days before it starts to crack. The important caveat: the extreme results (≥100 days) are disproportionately 2008-weighted. The pattern held in 2011–2014 with smaller magnitude, and held again in 2022 where SPY fell ~11% across the full March–July regime when oil repeatedly crossed above $100. The direction is consistent. The effect size is regime-dependent. If this is a brief spike, history says equities shrug it off. If oil sustains above $100 for 30+ days, every analog except 2013 shows the market breaking. $SPY $QQQ $VIX $USO #WTI #OIL



Qatar has paused efforts to rapidly revive production at the world’s largest liquefied natural gas facility after an attack on one of its tankers in the Strait of Hormuz raised fears that transit through the key waterway remains too risky