@sam_gatlin What’s the catalyst this time? Last time it was Trump reversing what caused the selloff.
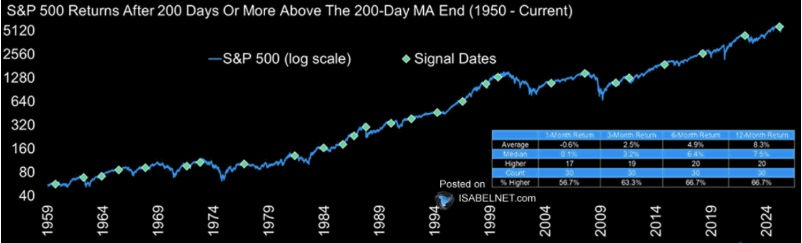
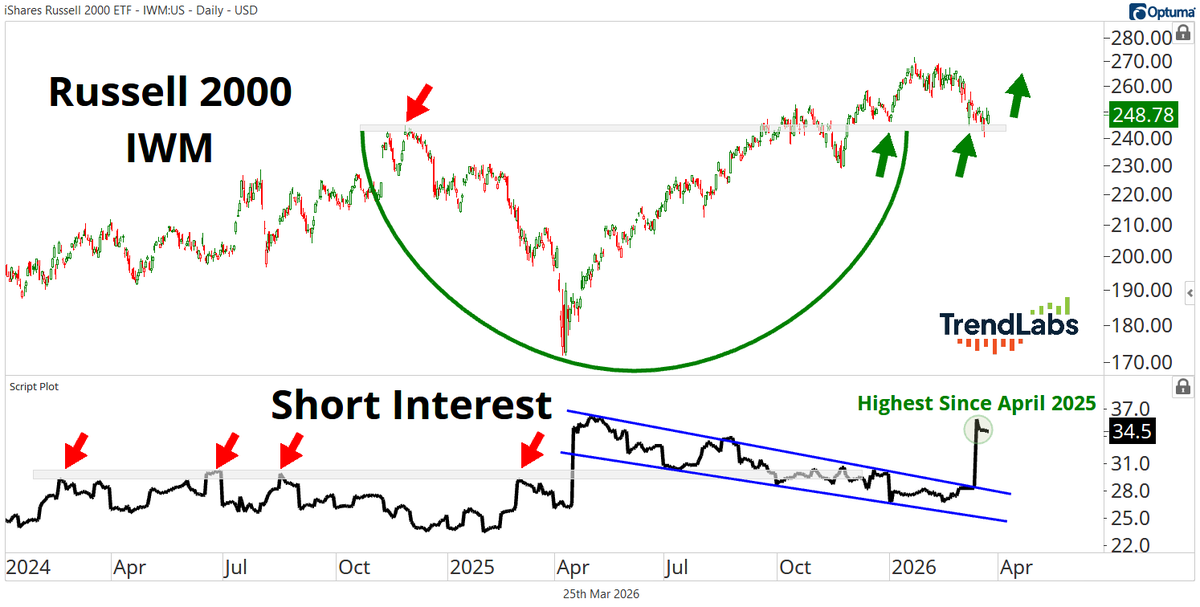
Hint: the war isn’t responsible for this selloff. Knowing the history of major market tops, this top started late 2025!
English
Josh Mullins
661 posts

@ETFbreakouts
I buy ETF breakouts and the strongest stocks inside them. Theme-first momentum trading | CANSLIM/VCP/EP style | Full-time trader.

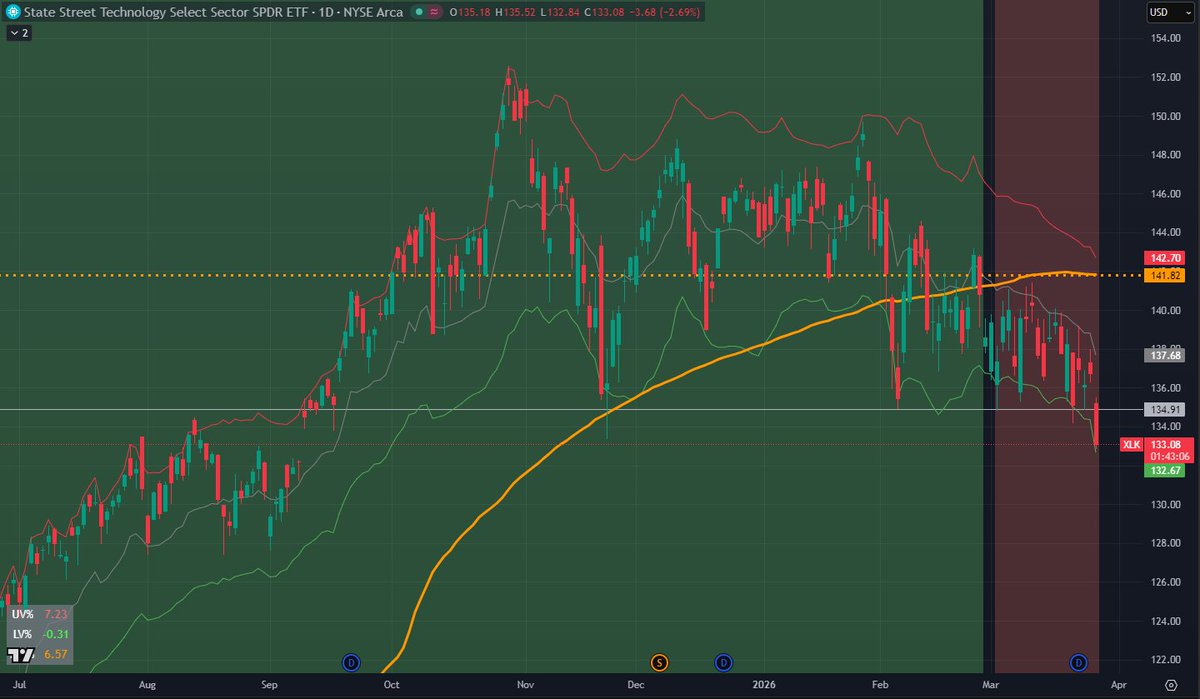
$XLK is forming a textbook descending triangle. Lower highs compressing into flat support around $135-136. Each rally is shorter and weaker than the last. This is what distribution looks like in slow motion. Sellers are getting more aggressive. Buyers are losing conviction. The triangle is tightening and one side is going to give. If this support breaks, tech doesn't just pull back — it breaks hard. Technology is 32% of the $SPX. Where tech goes, the index follows. This lines up with everything else I'm seeing right now. Former leaders failing at resistance. Breakouts reversing immediately. 200 DMA breadth deep in correction territory. The pattern is setting up. The breadth confirms it. Now we wait for the market to tell us when. Bounce ≠ bottom. 🐻


Good news: NYSE making ATH since 12/5/25 Bad News: percent of NYSE stocks above their 50 / 200 DMA peaked mid-Jan have been trending down. Add to this 7 distribution days YTD on NYSE And this is the best index! Nasdaq and S&P have shown significantly more distribution YTD

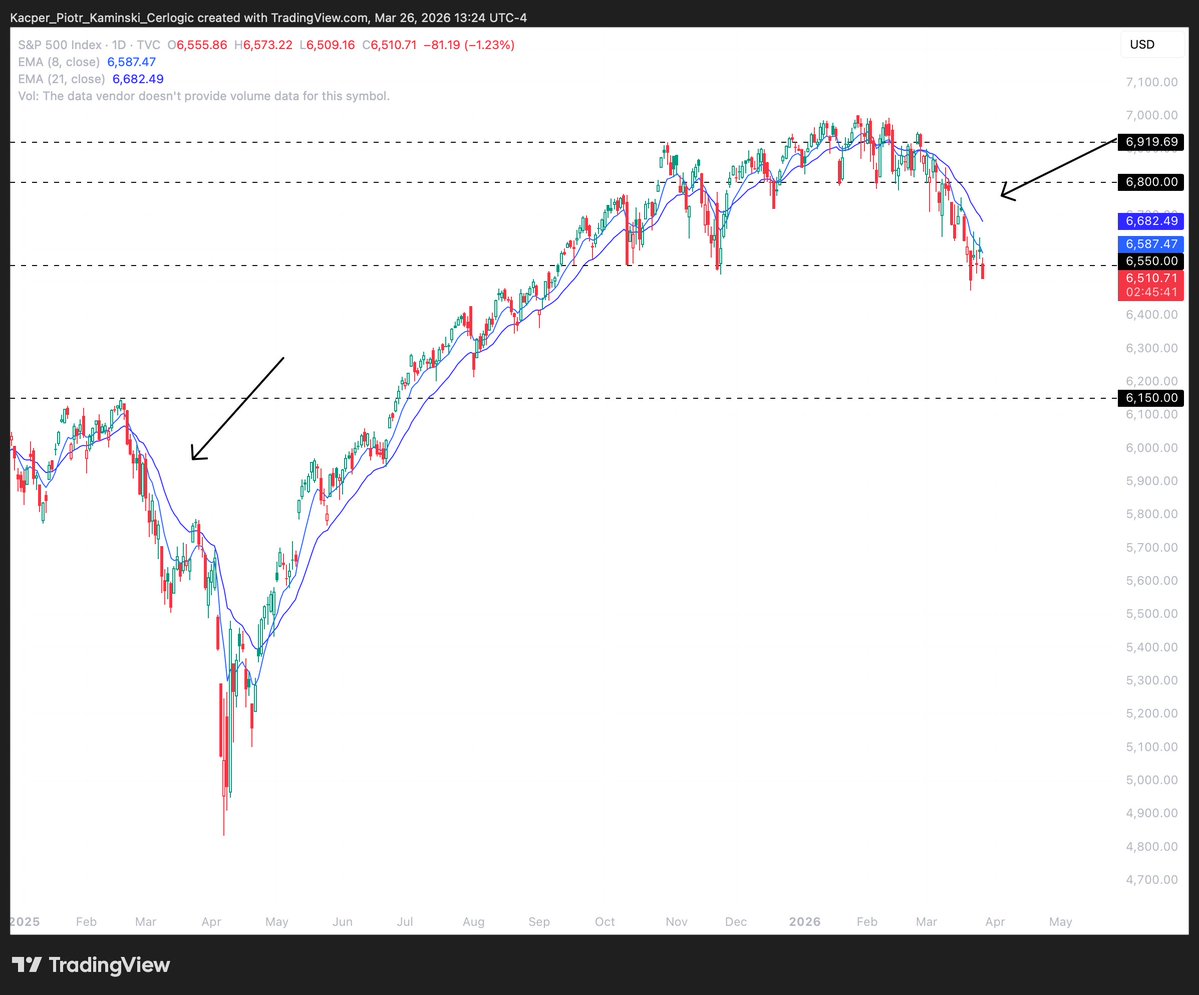
S&P 500 - $SPX / $SPY I have no idea what will happen, but below 6,550 there is an air pocket all the way to 6,150. I actually hope we get back up, still, I have to tell what I see.
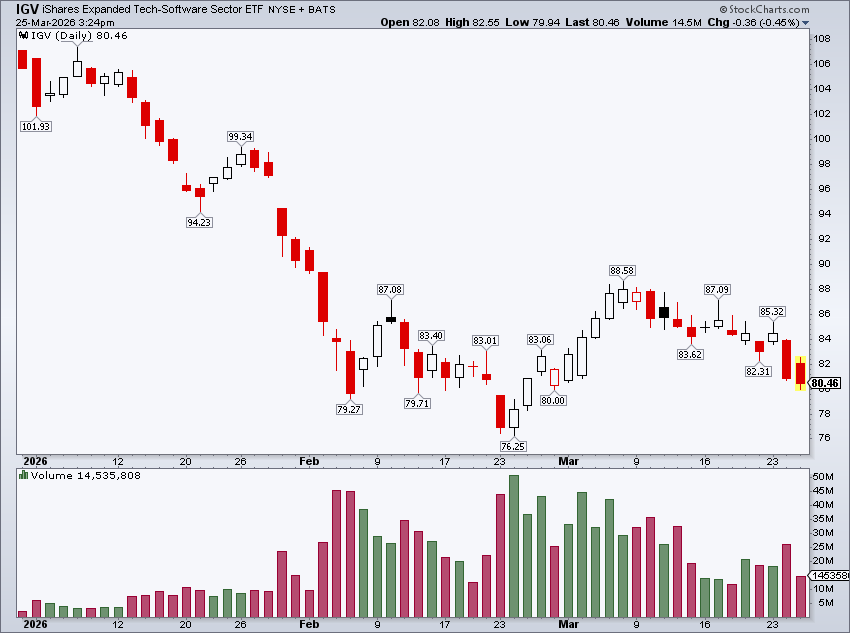
$MSFT just confirmed a broken downtrend trendline from 2013. A 13-year trendline. Gone. This isn't a pullback in an uptrend. This is structural damage to one of the most important stocks in the market. On 3/21 I flagged $IGV as one of the few constructive setups I was seeing — software was quietly building a base while everything else fell apart. It was one of the last bright spots. Not anymore. $IGV's largest holding just broke down hard, and the base is failing. No surprise — when the biggest weight in the ETF is in free fall, the pattern doesn't hold. One by one, the last remaining bright spots are going dark. Former leaders failing. Breakouts reversing. Now the few constructive bases that were forming are breaking down too. The odds of a strong leg down are increasing rapidly. x.com/ETFbreakouts/s…


$MOVE in confirmed uptrend, the downtrend from the April 2025 tarrif lows. More evidence of credit stress


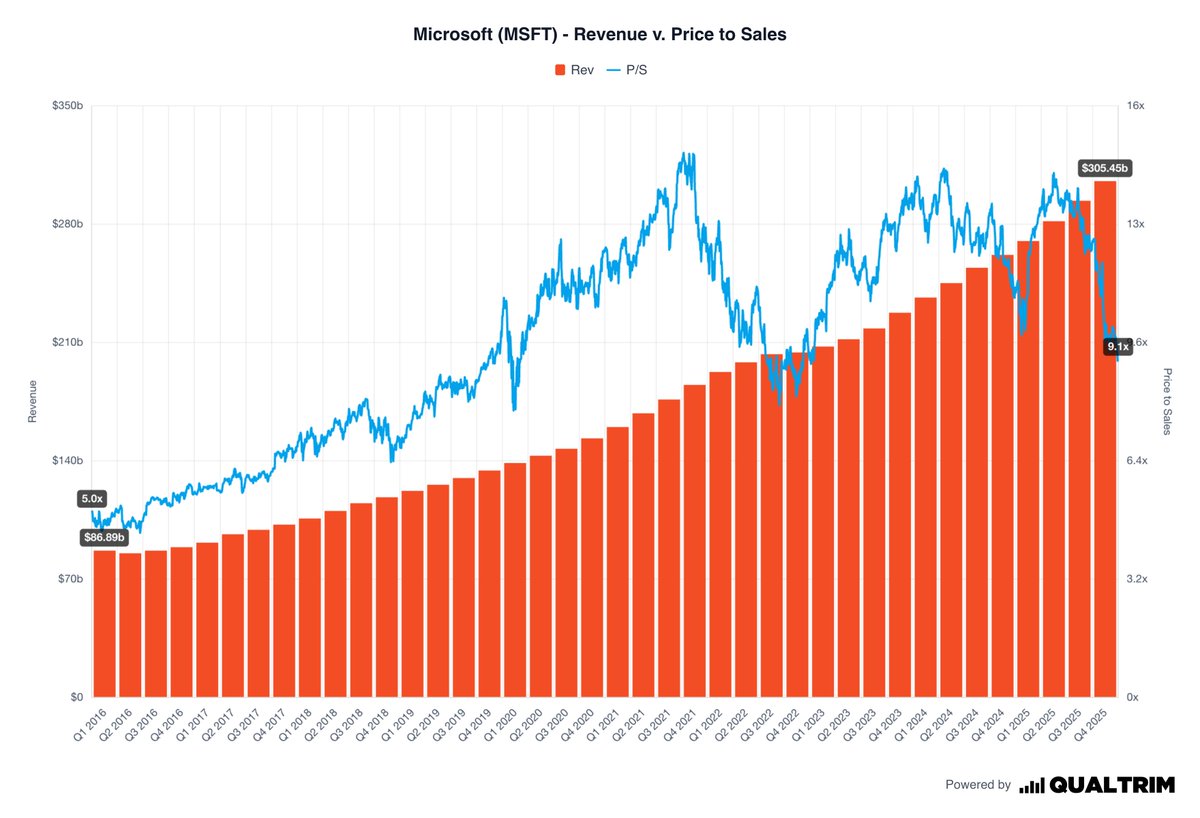
$MSFT Value Trap: Everyone's talking about $MSFT trading at its lowest forward P/E in years. They think it's cheap. It's not. It's a value trap. $MSFT has spent tens of billions on AI integration and the market is telling you it hasn't worked. Copilot adoption is underwhelming. Capex is exploding. Gross margins just hit a 3-year low. And Q3 operating margin guidance came in below consensus. The P/E compression is hiding the real story. Translation: that falling P/E ratio everyone is celebrating? It's not telling you the whole story. Price-to-free-cash-flow: 37x against a 10-year median of ~33x. FCF yield is 2.7% — worse than 75% of its industry. Free cash flow actually declined in FY2025 while capex grew 58%. They're tracking toward $120B+ in capex for FY2026. Cash is going out the door faster than it's coming back. Here's what the "low P/E" crowd isn't thinking about: $MSFT is spending $120B+ this year building AI data centers. That capex doesn't hit earnings all at once — it gets expensed over the next 5+ years as depreciation. In plain English: the costs from today's spending spree will be dragging down earnings well into 2028, 2029, 2030. That "cheap" P/E? It's about to get worse, not better — even if revenue grows. A falling P/E with deteriorating free cash flow and a future depreciation headwind isn't cheap. It's a trap. The stock is down because institutional holders are repricing the AI monetization timeline — not because the market is mispricing the business. Cheap gets cheaper when the tide is going out. 🐻

Once this war is over it’s gonna be a RIPPER $MSFT is dirt cheap
Are we due for a bounce? The breadth data says yes. % of stocks above their 20 DMA on $SPX, $NYA, and $COMPQ: all deeply oversold. Short-term bounce conditions are here. 50 DMA breadth is also approaching bounce territory. This one matters more — bounces here last more than a few days. The kind that makes people think the bottom is in. It's not. More on that tomorrow. I flagged the $NYA top using breadth divergences on 3/1 x.com/ETFbreakouts/s…. Same framework, new signal. Don't confuse a bounce for a bottom. 🐻


$MSFT Value Trap: Everyone's talking about $MSFT trading at its lowest forward P/E in years. They think it's cheap. It's not. It's a value trap. $MSFT has spent tens of billions on AI integration and the market is telling you it hasn't worked. Copilot adoption is underwhelming. Capex is exploding. Gross margins just hit a 3-year low. And Q3 operating margin guidance came in below consensus. The P/E compression is hiding the real story. Translation: that falling P/E ratio everyone is celebrating? It's not telling you the whole story. Price-to-free-cash-flow: 37x against a 10-year median of ~33x. FCF yield is 2.7% — worse than 75% of its industry. Free cash flow actually declined in FY2025 while capex grew 58%. They're tracking toward $120B+ in capex for FY2026. Cash is going out the door faster than it's coming back. Here's what the "low P/E" crowd isn't thinking about: $MSFT is spending $120B+ this year building AI data centers. That capex doesn't hit earnings all at once — it gets expensed over the next 5+ years as depreciation. In plain English: the costs from today's spending spree will be dragging down earnings well into 2028, 2029, 2030. That "cheap" P/E? It's about to get worse, not better — even if revenue grows. A falling P/E with deteriorating free cash flow and a future depreciation headwind isn't cheap. It's a trap. The stock is down because institutional holders are repricing the AI monetization timeline — not because the market is mispricing the business. Cheap gets cheaper when the tide is going out. 🐻

$MSFT Value Trap: Everyone's talking about $MSFT trading at its lowest forward P/E in years. They think it's cheap. It's not. It's a value trap. $MSFT has spent tens of billions on AI integration and the market is telling you it hasn't worked. Copilot adoption is underwhelming. Capex is exploding. Gross margins just hit a 3-year low. And Q3 operating margin guidance came in below consensus. The P/E compression is hiding the real story. Translation: that falling P/E ratio everyone is celebrating? It's not telling you the whole story. Price-to-free-cash-flow: 37x against a 10-year median of ~33x. FCF yield is 2.7% — worse than 75% of its industry. Free cash flow actually declined in FY2025 while capex grew 58%. They're tracking toward $120B+ in capex for FY2026. Cash is going out the door faster than it's coming back. Here's what the "low P/E" crowd isn't thinking about: $MSFT is spending $120B+ this year building AI data centers. That capex doesn't hit earnings all at once — it gets expensed over the next 5+ years as depreciation. In plain English: the costs from today's spending spree will be dragging down earnings well into 2028, 2029, 2030. That "cheap" P/E? It's about to get worse, not better — even if revenue grows. A falling P/E with deteriorating free cash flow and a future depreciation headwind isn't cheap. It's a trap. The stock is down because institutional holders are repricing the AI monetization timeline — not because the market is mispricing the business. Cheap gets cheaper when the tide is going out. 🐻