David Schlotthauer

4.4K posts

David Schlotthauer banner
David Schlotthauer

David Schlotthauer

@Weatherunited1

Weather Youtuber | 74,929 Subscribers | Friendly | Advanced Weather Forecaster | Weather Expert | Weather Geek |
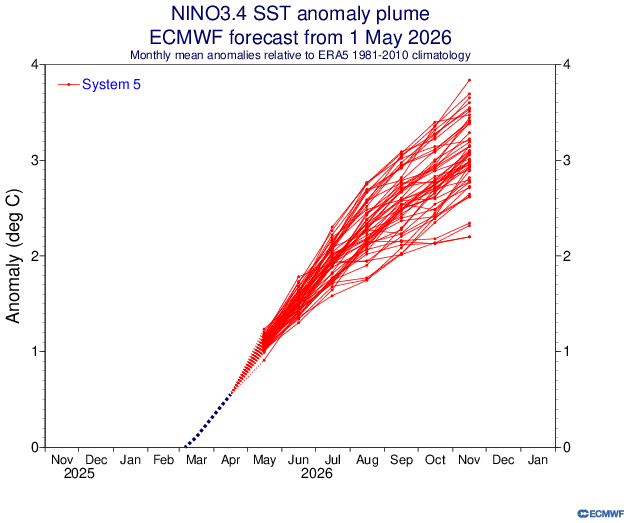
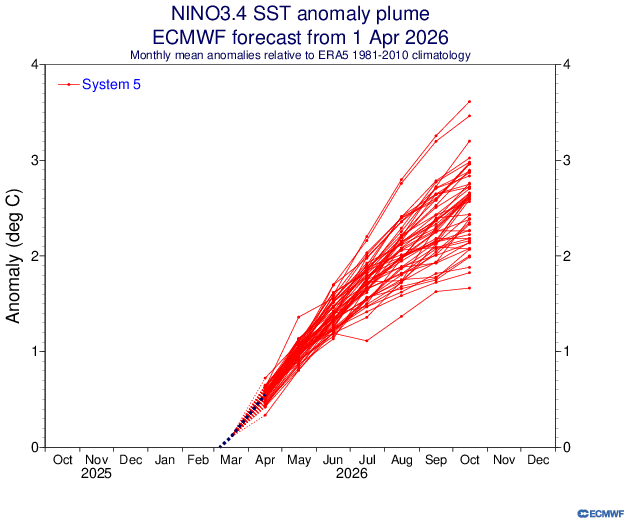
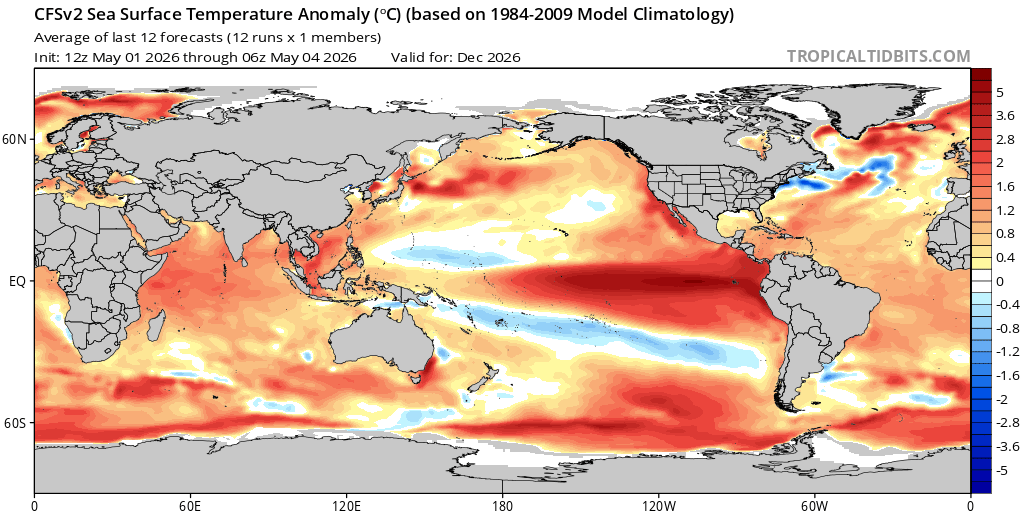
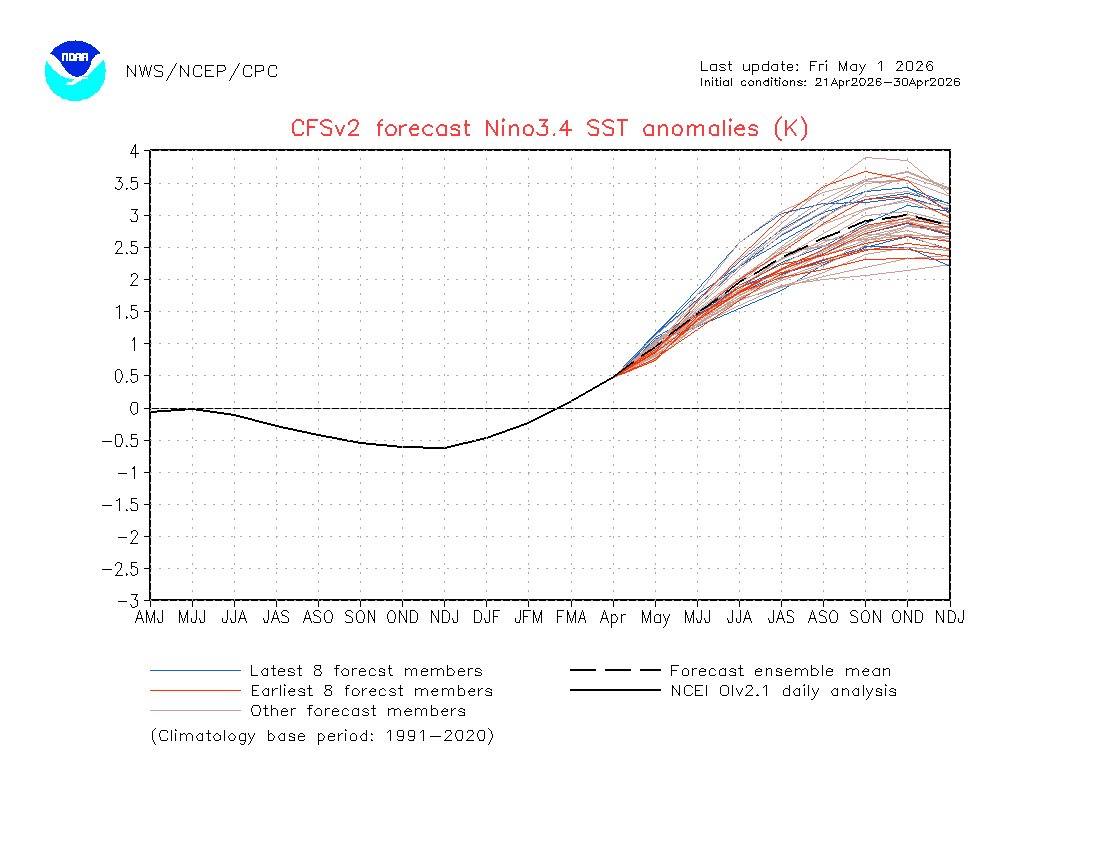
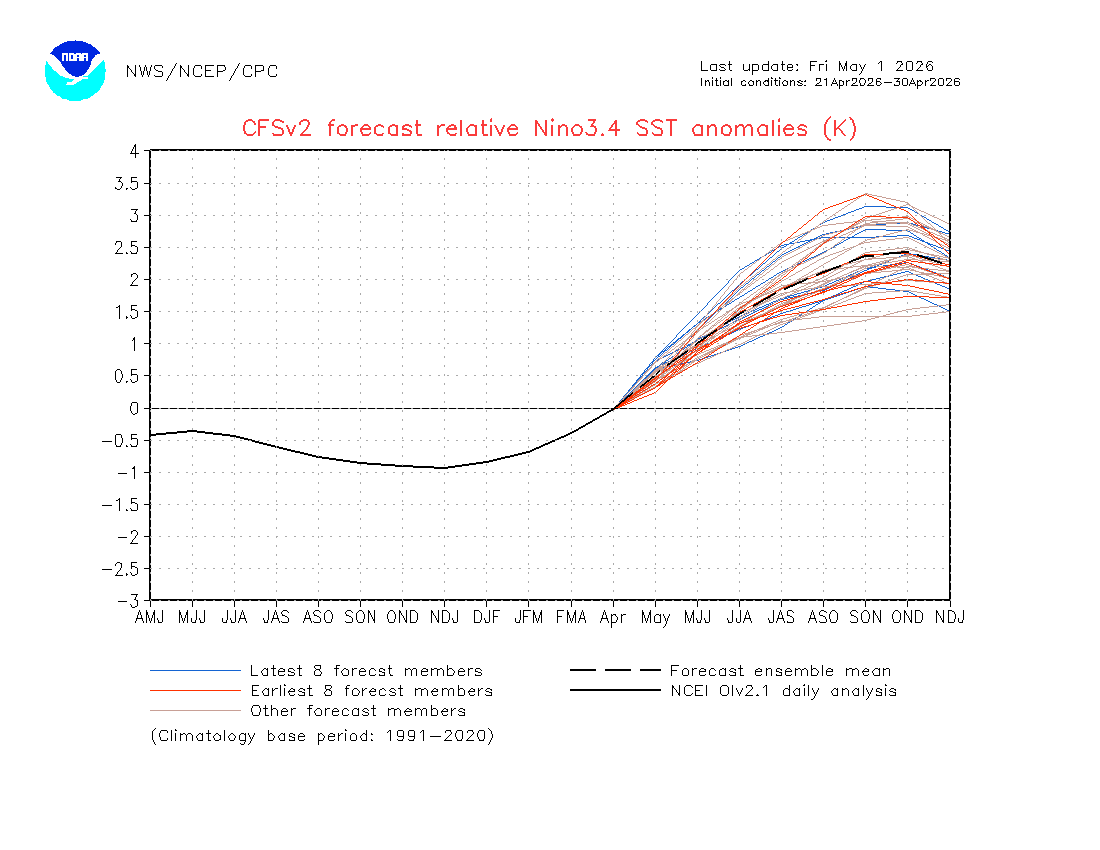
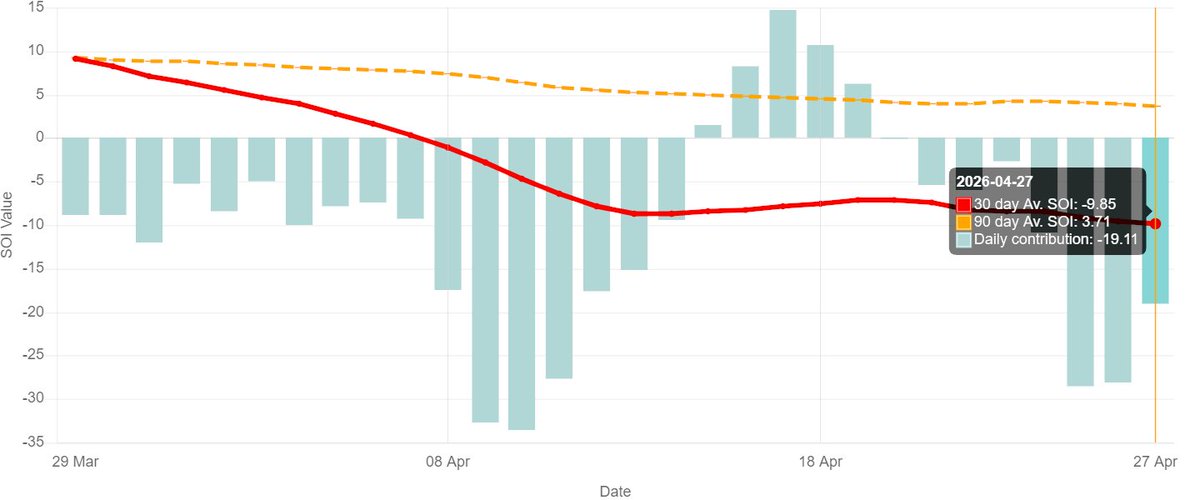
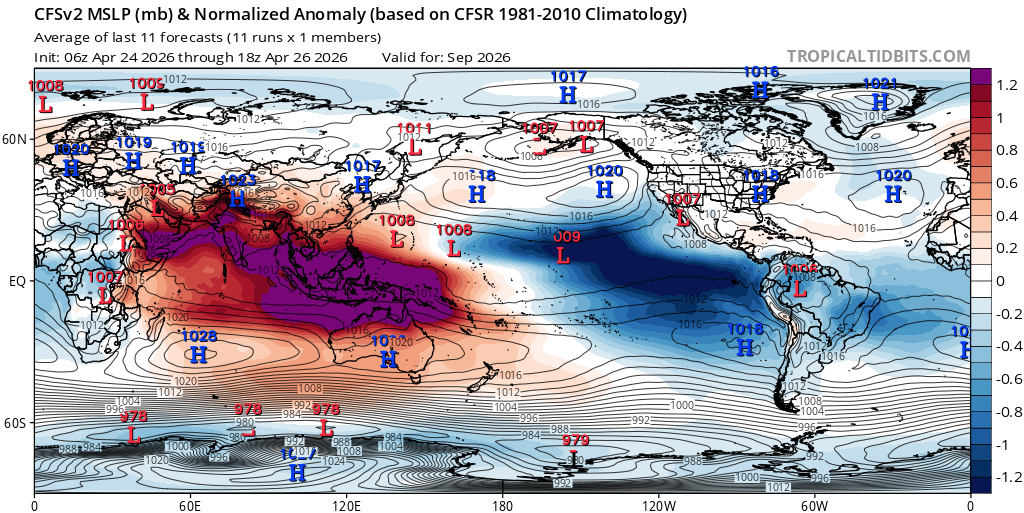
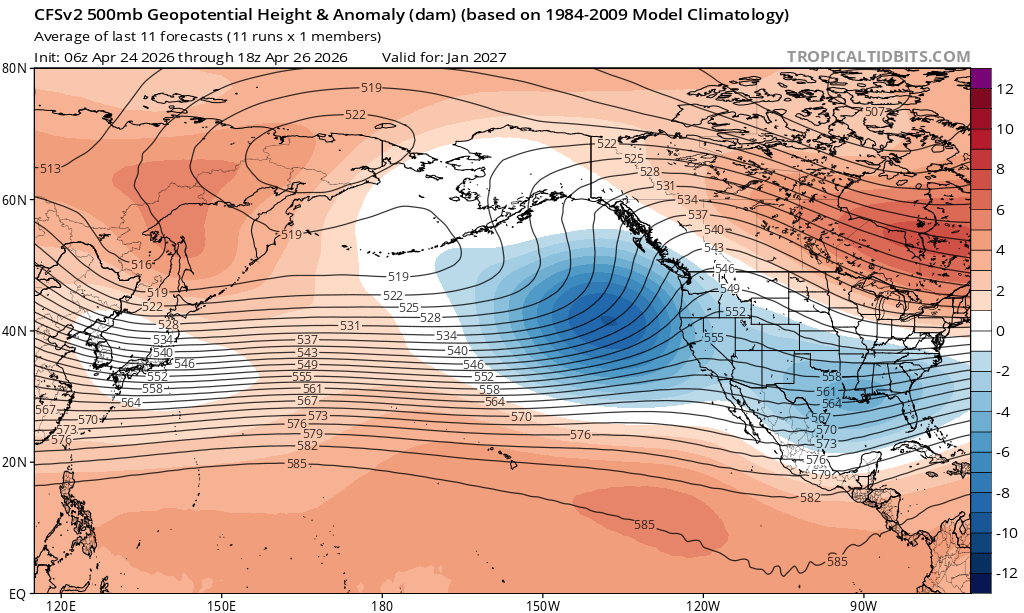
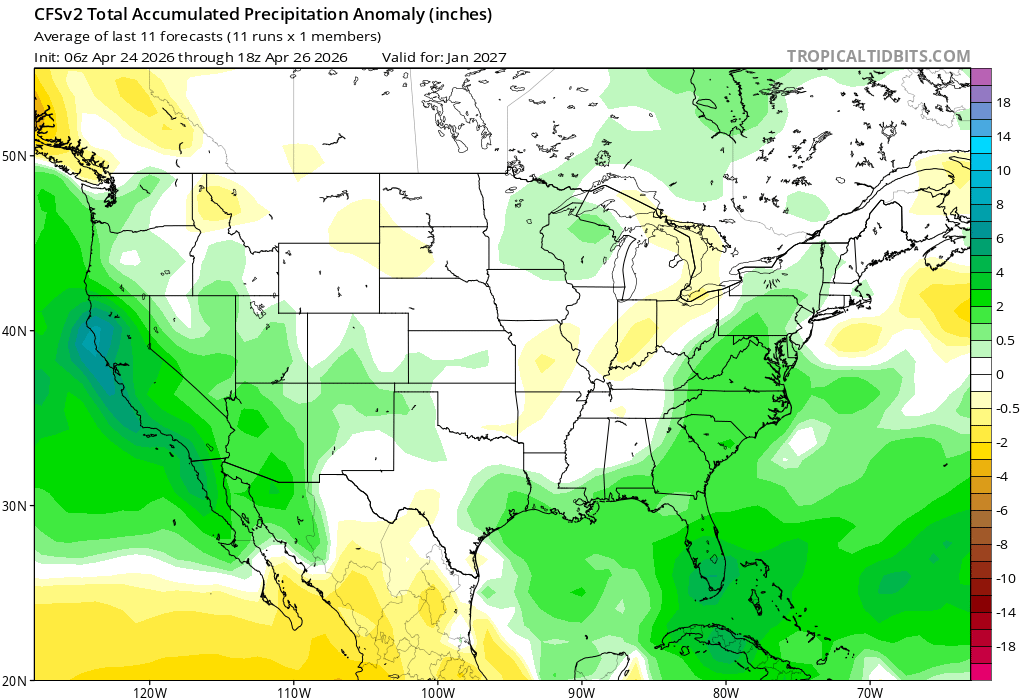
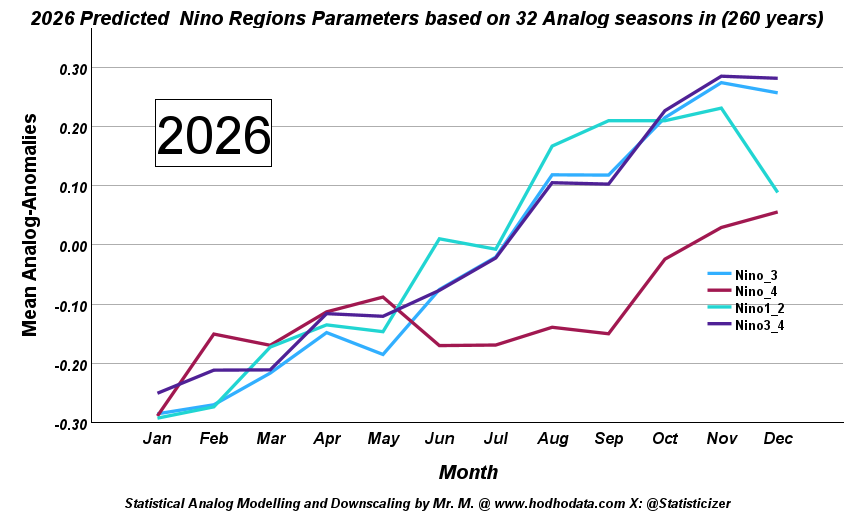
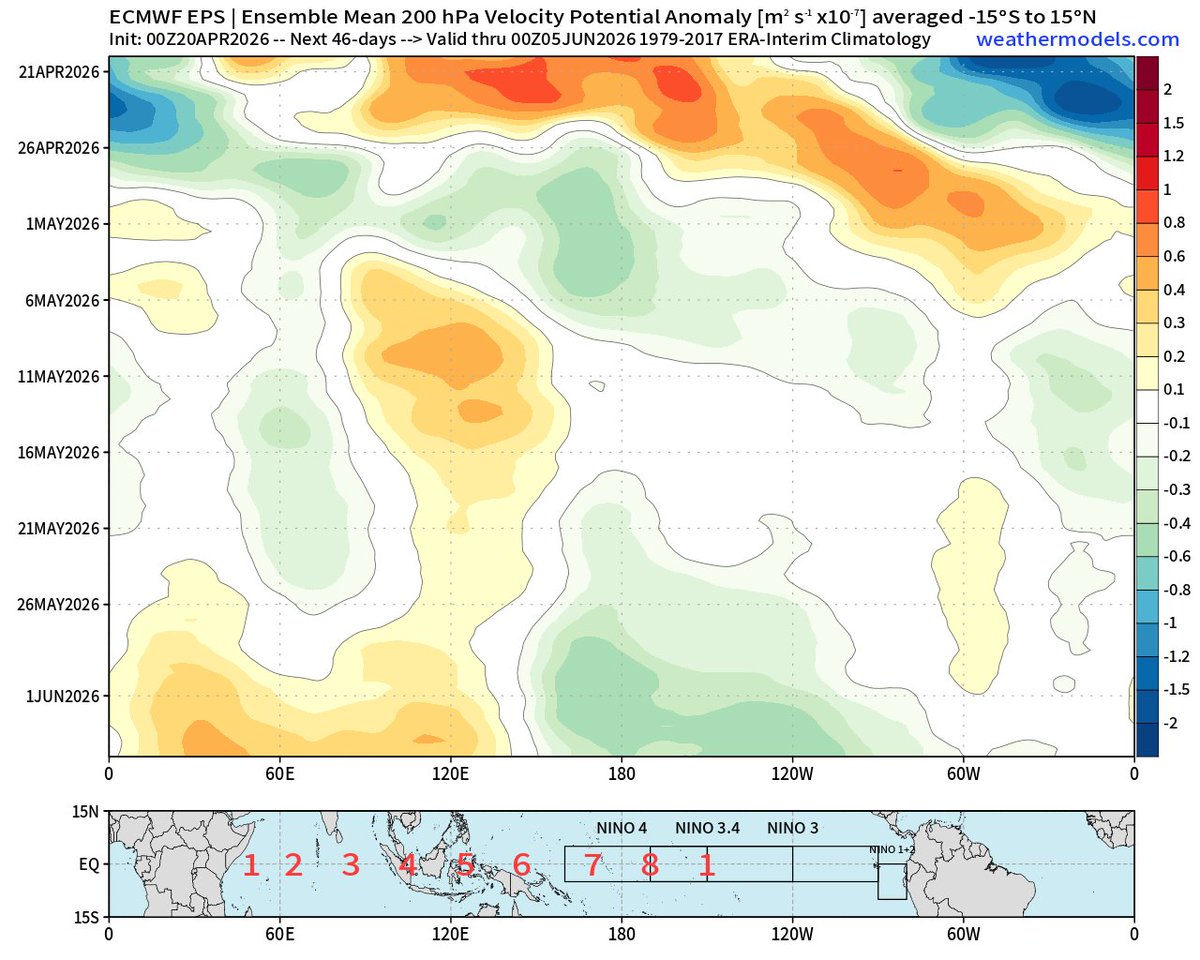
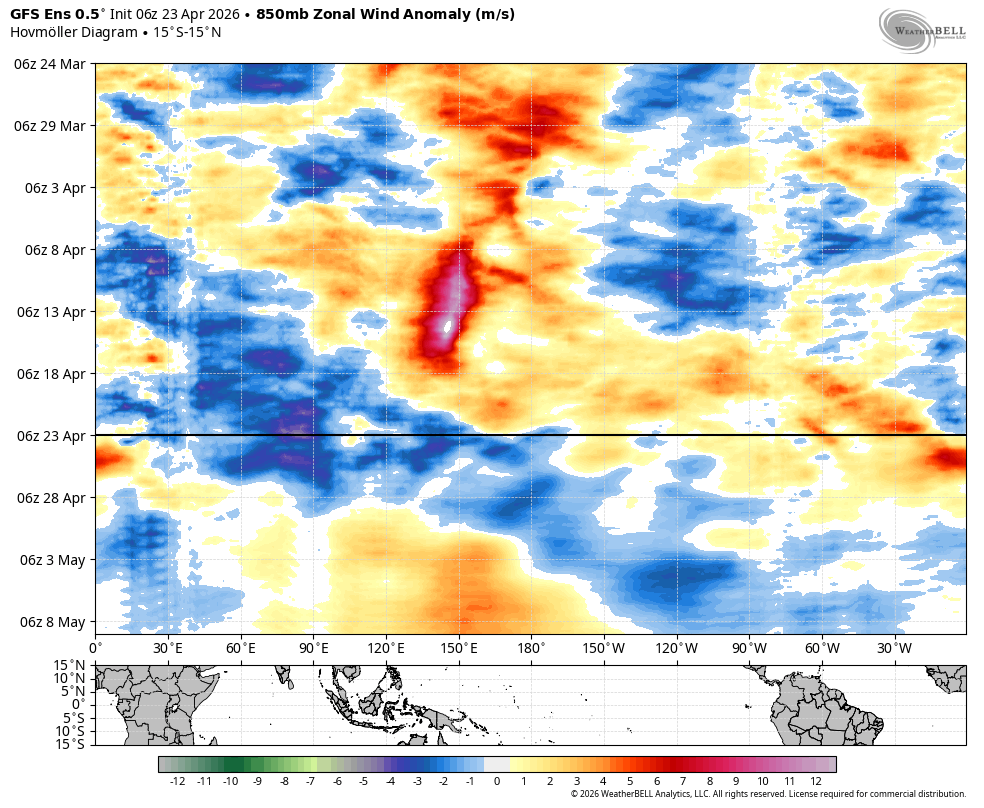
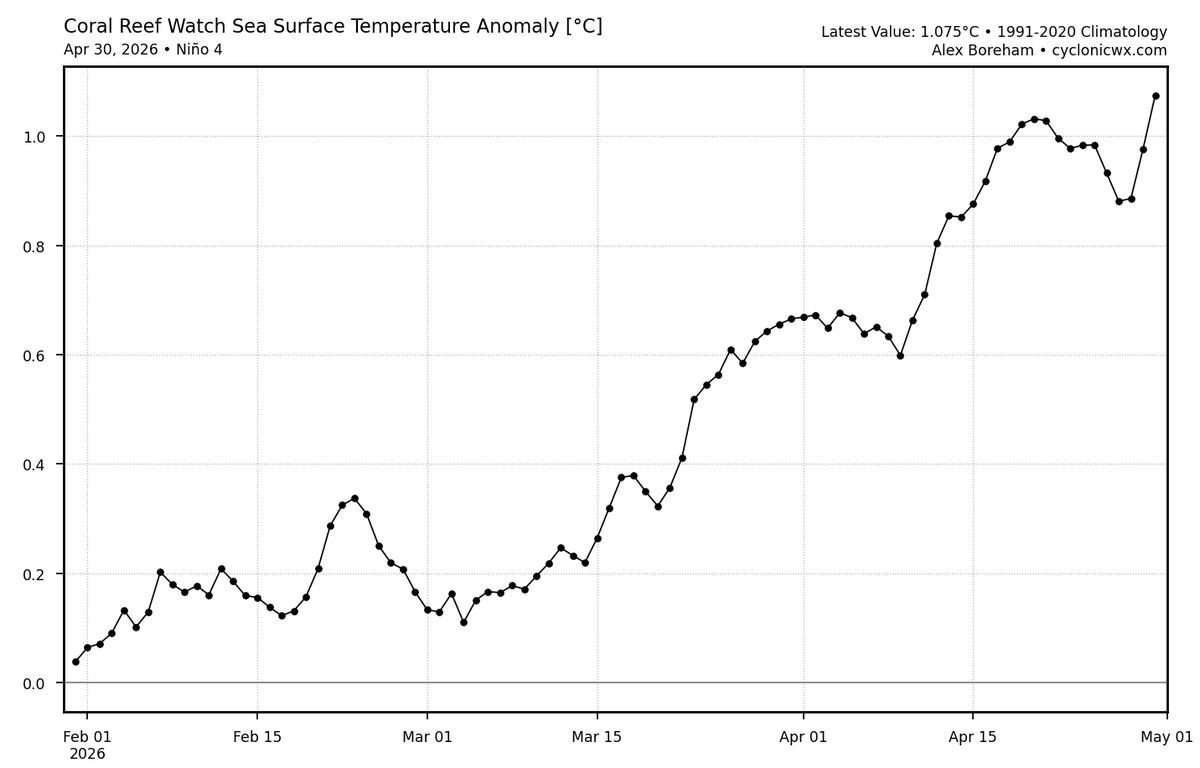
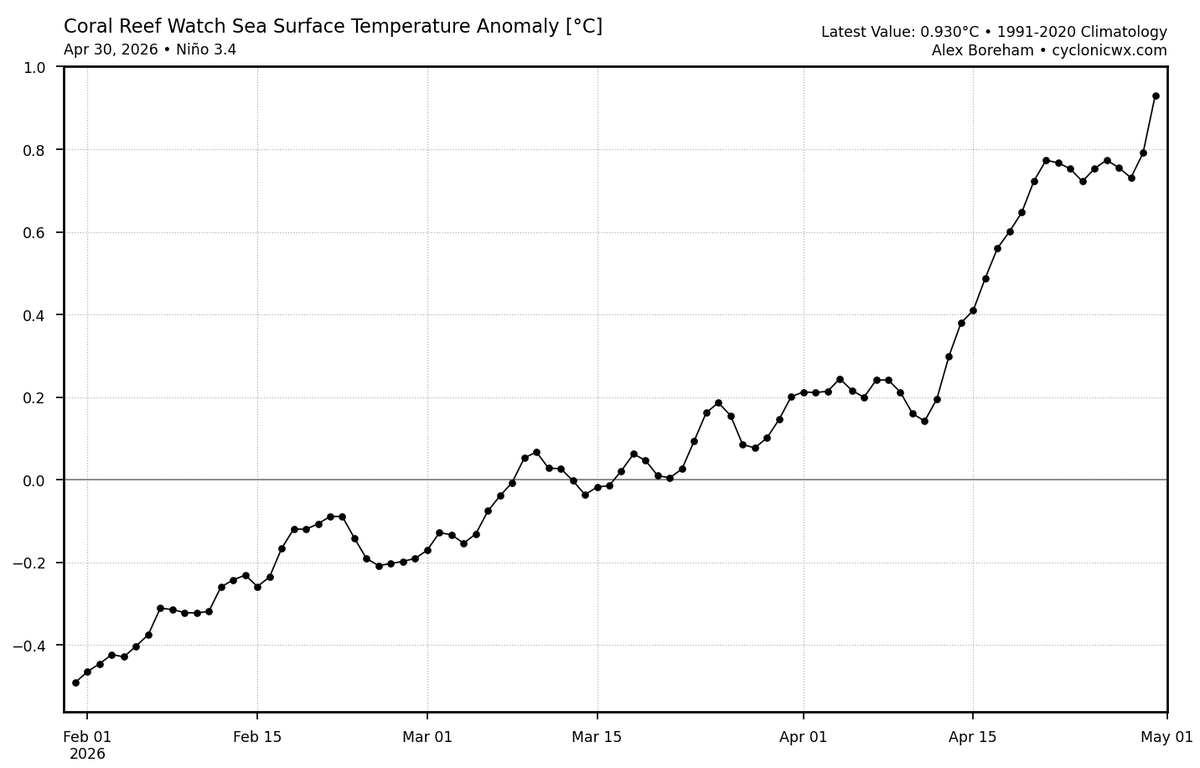
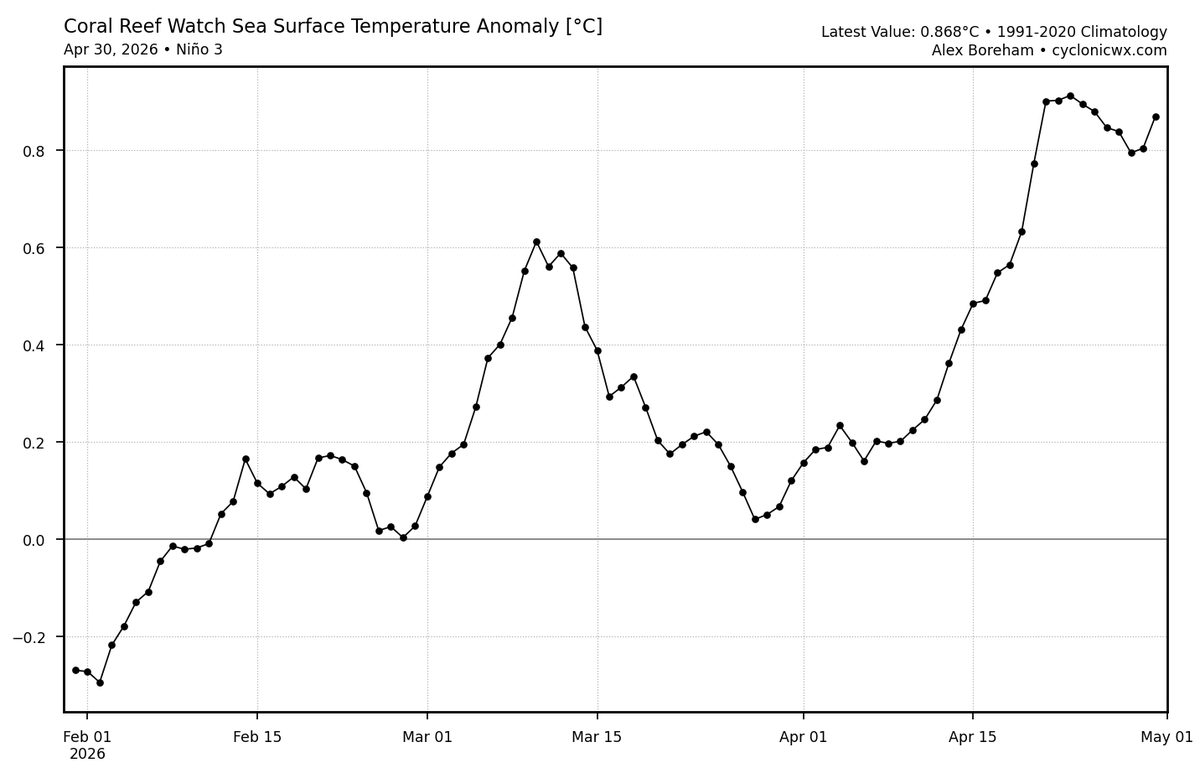
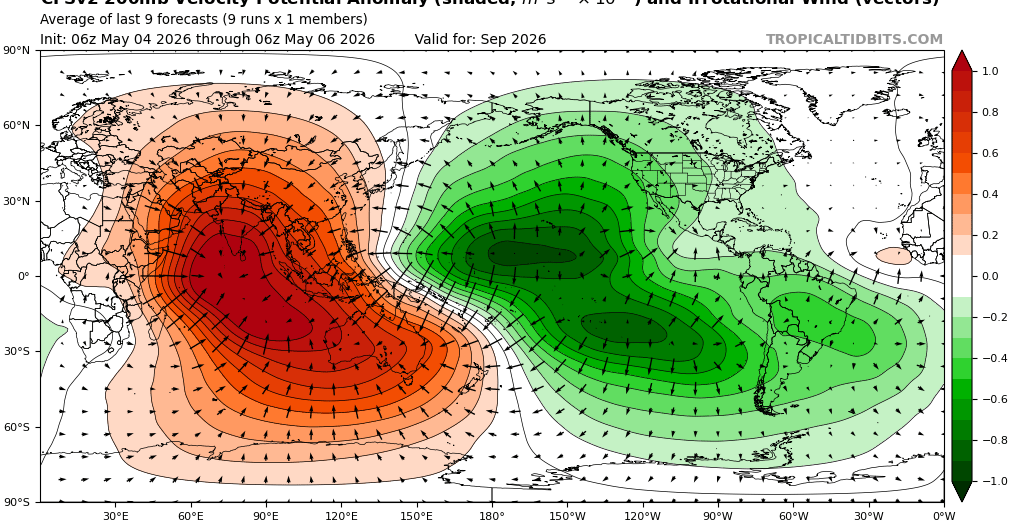
Sacramento, CA Katılım Ekim 2014
184 Takip Edilen2.5K Takipçiler
David Schlotthauer
David Schlotthauer@Weatherunited1·
This is the exact opposite of a hyperactive hurricane season in the Atlantic. Might just be the quietest on record.
David Schlotthauer tweet media
English
4
3
36
2.1K
David Schlotthauer
David Schlotthauer@Weatherunited1·
@novasufferer134 I believe it's the traditional index. I looked all around and could not find the RONI index from the ECMWF
English
1
0
2
32
DC
DC@novasufferer134·
@Weatherunited1 That’s oni right? Or is it adjusted
English
1
0
2
20
David Schlotthauer
David Schlotthauer@Weatherunited1·
The latest ECMWF-ENS plumes once again have trended upward in their May forecast guidance. At this time, the ensemble mean now calls for this El Niño to peak at 3.2 °C compared to 2.8 °C on its April 1 forecast last month. You can clearly see the difference in the images below. I'll have my El Niño update released on my YouTube channel today at 3:30 pm PDT. @WeatherForce2024" target="_blank" rel="nofollow noopener">youtube.com/@WeatherForce2
David Schlotthauer tweet mediaDavid Schlotthauer tweet media
English
1
0
14
811
DC
DC@novasufferer134·
@Weatherunited1 In terms of roni will it be the highest ever?
English
1
0
1
56
David Schlotthauer
David Schlotthauer@Weatherunited1·
Dang, you can't get as clear of an El Niño pattern as you can get this coming Winter 2026-2027. Also, CFSv2 now predicts a 3.5 °C El Niño.
David Schlotthauer tweet mediaDavid Schlotthauer tweet mediaDavid Schlotthauer tweet mediaDavid Schlotthauer tweet media
English
3
19
139
6.7K
David Schlotthauer
David Schlotthauer@Weatherunited1·
The CFS V2 continues to trend ever so slightly upward only added onto 0.1°C in the RONI index over the last couple of days making confidence higher for a substantial El Niño. It is also worth noting a lot of the early forecasts the red lines you see have trended upward as well.
David Schlotthauer tweet media
English
0
2
25
1.4K
David Schlotthauer
David Schlotthauer@Weatherunited1·
I can't remember a time when there was this much subsurface warmth!. Anomalies are still around the 7-8 C range, with anomalies around 5-6 C in the very far EPAC. It's pretty clear now that at least at the very least we have a very strong El Niño by late fall, with a 45% chance we have a Super El Niño (+2.5C) and a 20% of seeing SSTs around 3.0 C above average.
GIF
English
2
18
76
5.9K
David Schlotthauer
David Schlotthauer@Weatherunited1·
Looks like NOAA extended their Axis to now include 4C. And wow, some of the members are very aggressive. Latest CFSv2 now predicts 2.5 °C of warming even in the RONI, while the traditional is even higher at 3.0 °C. With a few members threatning 3.8-4.0C of peak anomalies by Late fall into the Winter of 2026-2027.
David Schlotthauer tweet mediaDavid Schlotthauer tweet media
English
1
13
61
3.6K
David Schlotthauer
David Schlotthauer@Weatherunited1·
Now, not much has changed with my outlook from the previous update. While we have to get past the so-called "Spring Predictability Barrier," there is way more than enough subsurface warmth underneath the ocean surface to trigger a substantial El Niño event by late Summer. Now, whether or not it will be weak, moderate, strong, very strong, or "SUPER" remains uncertain, but given how the atmosphere has been responding, especially with a couple of record-shattering WWB since January, with the most recent one about a 3 weeks ago. I would not be surprised if this rivals at least 1982-1983 El Niño or even 1997-1998. Now, the chances this exceeds the El Niño of 2015-2016 are not very likely, as more subsurface warmth would be needed to trigger such an event, but a high-end esolon El Niño event in the realm of super +2.0 °C is a distinct possibility. Now, I want to be realistic & honest here. No two or 3 super El Niños are the same; look at 1982-83 for an example the brought some of the worst impacts worldwide. The 2015-16 El Niño, while deemed stronger, was not as far-reaching as that event. An El Niño is "NOT" a weather system or a storm system, but a climate phenomenon that changes the positioning of jetstreams across the planet. We have to take into consideration that teleconnections such as the WPO, EPO, PNA, AO, NAO, QBO, TPI, etc., have far wider-reaching impacts than ENSO alone. Now, in a warming climate, nothing is guaranteed for a given region. The only thing we can go off of is seasonal weather prediction to give us a rough idea of how the long-term weather will play out on a monthly scale. My next El Niño update is scheduled for May 7, 2026. Stay tuned. @WeathermanAAA_ @AndyHazelton @OSUWXGUY @AlterComboWX @cyclonicwx @FloridaTropics1 @Weather_West @EthanB86419472 @PatsPredictor @webberweather @BenNollWeather @alextropicalwx @ryanhallyall @KevinRi73294624 @Simcoe12_Wx @MaxVelocityWX @WorldClimateSvc #elnino #weather #climate #news
David Schlotthauer tweet mediaDavid Schlotthauer tweet mediaDavid Schlotthauer tweet media
English
1
0
6
447
David Schlotthauer
David Schlotthauer@Weatherunited1·
So, is the atmosphere responding to any emerging El Niño base state signal? Well, when looking at the latest 30-day SOI index, it's currently at -9.85 while the 90-day average is at 3.71 with the RSOI at -2.52, meaning the atmosphere is slowly beginning to respond, but not very good coupling yet, but getting there though. Now the SOI calculates the pressure from Darwin, Australia, in hpa, and another reading is taken in the CPAC in Tahiti when the pressure is lower than normal over Tahiti than in Darwin, which yields a negative SOI. The opposite occurs with a positive value. Right now, we are seeing slightly lower than normal pressures over Tahiti than we are in Darwin.
David Schlotthauer tweet mediaDavid Schlotthauer tweet media
English
1
0
4
344
David Schlotthauer
David Schlotthauer@Weatherunited1·
El Niño Update April 27, 2026 Sea surface temperatures continue to warm at a quick rate as a downwelling oceanic Kelvin wave continues to progress eastward. Now, what's more impressive is the subsurface warmth between 75-150m with some anomalies now approaching or exceeding 7-8 °C, a hallmark for developing El Niños. But what's even cooler is you can literally see the warm water slosh eastward in the last 60 days. The 4 gifs below show strong evidence of the Kelvin wave. Because of this there is nearly a 100% chance El Niño will develop by mid-summer 2026.
GIF
GIF
GIF
GIF
English
4
10
57
3.9K
David Schlotthauer
David Schlotthauer@Weatherunited1·
@Statisticizer There are way too many indicators to suggest a Very Strong "Super El Niño" by Late Fall. Subsurface temps are maxing out at +7C. This post won't age well down the line.
English
1
0
1
179
Hodhodata@statistics
Hodhodata@statistics@Statisticizer·
⚡️🌍 ENSO 2026–2027 Outlook — Analog based analysis vs “Super El Niño” Narrative. Lately there’s been a lot of noise on social media about a possible “super El Niño” developing, linked to panic and fear from heat waves, droughts and famines . I understand where that excitement comes from—ENSO always draws attention—but after digging deeply into the data, I think the situation is possibly being overstated. I’ve been working on a reconstructed ENSO framework that extends beyond the modern record, using ~260–280 years of analog conditions, adjusted for today’s warmer climate background . The approach combines analog matching, clustering, latent factor and growth modeling, and machine learning, all within a physically constrained setup that links oceanic, atmospheric, and external forcings via Granger-Causality Analytic framework . So instead of relying on one index or short-term signals, this is more of a trajectory-based view of ENSO evolution using 38 ensembles . 📊 What the signal actually suggests 🔹 2026 — A gradual, structured El Niño The system starts off weak, then moves into positive territory around late spring, and continues strengthening through the year, peaking toward October–December. But here’s the key point: The amplitude is moderate, not extreme Several indicators don’t even reach Modoki thresholds (~0.5) until maybe autumn. The structure looks more basin-wide than sharply central-Pacific driven In plain terms, this doesn’t behave like a “super El Niño.” It looks more like a well-organized moderate to strong but controlled event. 🔹 2027 — A slow fade, not a flip Going into 2027, the system doesn’t crash or reverse aggressively. Instead: Residual warmth lingers early in the year Then a gradual weakening takes over By late 2027, most signals are back near neutral There’s no strong evidence here for a rapid La Niña transition, at least from this analog perspective. ⚖️ Putting it into context If this were truly heading toward a super El Niño, we would expect: Stronger and more synchronized peaks across indices even during summer months Clear and sustained threshold exceedance A more aggressive coupling between ocean and atmosphere That’s simply not what the data is showing right now . 🌐 Why this matters ENSO strength and structure shape a lot of downstream impacts. A moderate event like this still matters—but it behaves differently: Impacts tend to be more uneven geographically Teleconnections are present but less extreme The system shows variability rather than dominance 🧭 My take If I had to summarize it simply: ➡️ 2026: Moderate El Niño, well-coupled but not too extreme and peaking near November-December , there are no ( No hunger or starvation or heat waves fears ) because the climax would be in Autumn Not summer although there is fast develoment. ➡️ 2027: Gradual decay toward neutral ➡️ No strong support (at this stage) for a “super El Niño” scenario even during summer. Forecasting ENSO is never about certainty—it’s about probabilities and structure. And from what I’m seeing, this is a coherent, physically consistent signal… just not an extreme one. In this analysis the Spring-predictability barrier had been constrained to allow smoothed parameters . Also, the modern super-Nino's were considered as a background possible scenario ( total = 6-8 seasons in last 175 years that I could pinpoint ) — Statistical Modelling By Mr. M the chief data scientist at Hodhodata.com | @Statisticizer
Hodhodata@statistics tweet mediaHodhodata@statistics tweet mediaHodhodata@statistics tweet mediaHodhodata@statistics tweet media
English
12
18
81
11.5K
David Schlotthauer
David Schlotthauer@Weatherunited1·
This is not too surprising given that El Niño is rapidly evolving in urnist. Not looking at the 200mb VPA clearly shows a very pronounced standing wave over the IDL from April 28th through perhaps May 15th, then again from Late May into early June. All I got to say is El Niño is only going to get way stronger from here.
David Schlotthauer tweet mediaDavid Schlotthauer tweet media
English
0
0
4
390
David Schlotthauer
David Schlotthauer@Weatherunited1·
While there's medium confidence at the moment. There's notable model run consistency on another potentially significant WWB by the very, very end of April and likely to last through a least into the middle or even the end of May. Even the Ensambles are picking up on this quite well.
David Schlotthauer tweet mediaDavid Schlotthauer tweet mediaDavid Schlotthauer tweet mediaDavid Schlotthauer tweet media
English
1
0
22
1.1K