Altcoin Trader
5.4K posts

Altcoin Trader
@comp_technician
Altcoin trader 📈 | Swinging #BTC & #Altcoins | Clean charts, smart setups & real TA | Crypto, macro & energy stocks 🚀
Katılım Ocak 2010
5 Takip Edilen238 Takipçiler

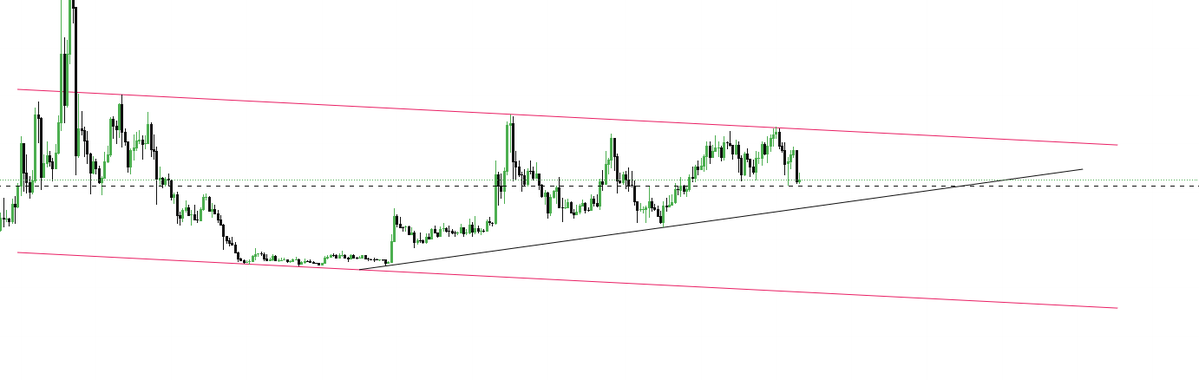
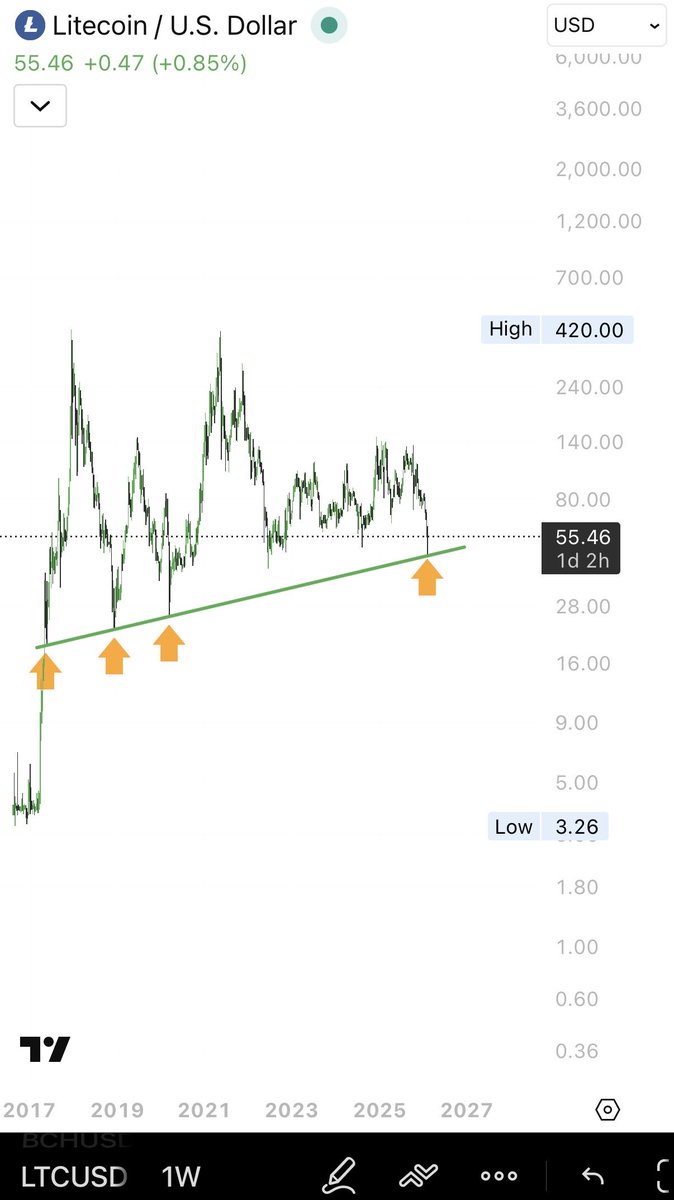
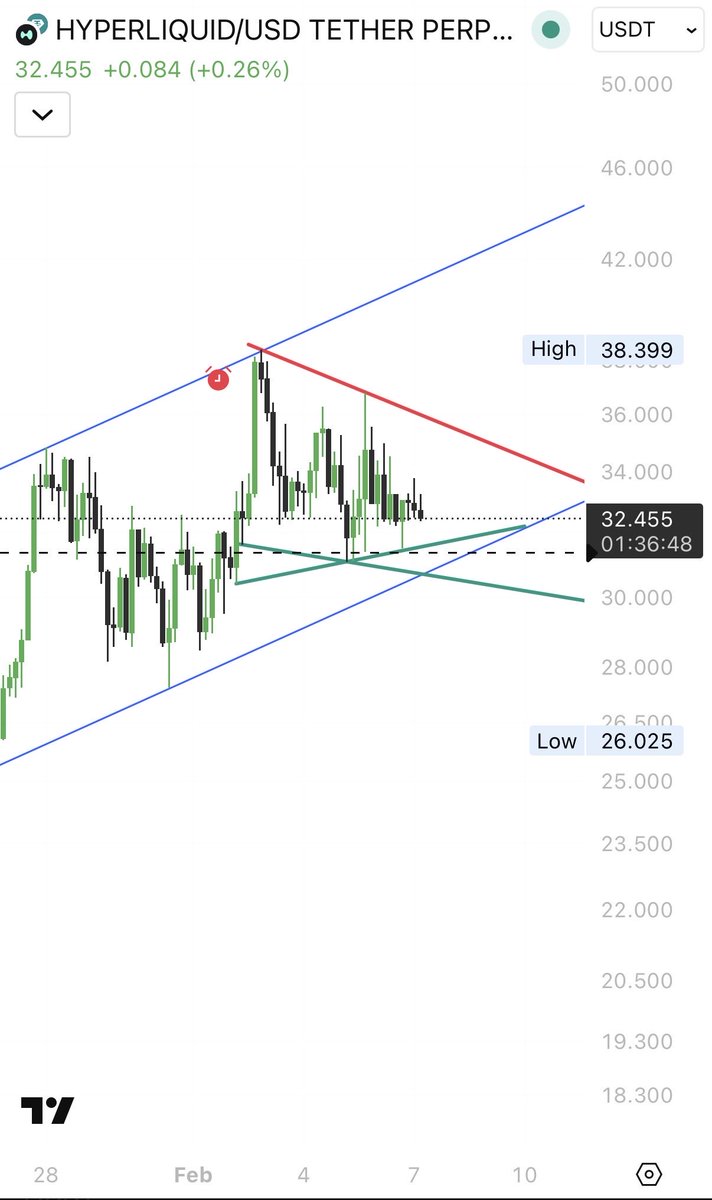
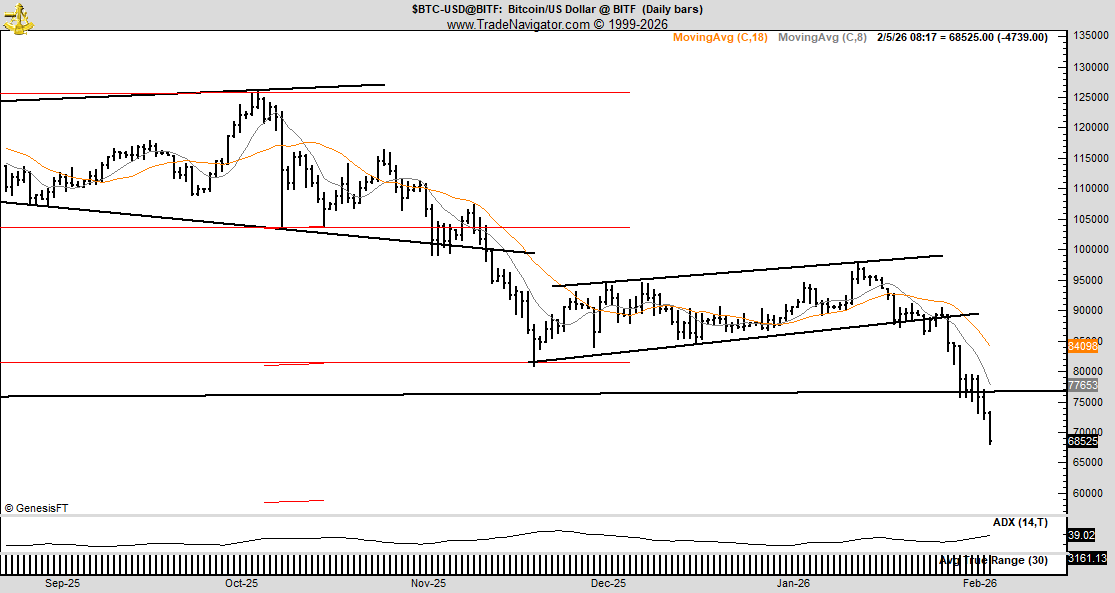
What if this isn’t a small correction… but the early stage of a major bear market? Price is compressing inside a rising support while the macro channel still trends down. A breakdown here could change the entire narrative.
Are we underestimating the downside? 👀
#Crypto
English
@CTD444 can this be integrated with Order Block? BB appears when OB failed right?
English

🚨FREE, OPEN-SOURCE BREAKER BLOCKS🚨
I am proud to announce the release of multi-timeframe breaker block indicator for the community.
This is, and will stay, completely free + open source.💻
LINKS👇:
LTF - tradingview.com/script/D76cXPD…
MTF -tradingview.com/script/0ZLFXWj…
HTF-tradingview.com/script/7hl4JJM…
- Live and Historical blocks under one roof
- All standard timeframes
- Possible to use in TV replay**
- Customisable differentiation for 1x, 2x, 3x + blocks
- Toggle labels
- Customisable lookback
Currently offers: 1m, 2m, 5m, 10m, 15m, 1h, 2h, 4h, 6h, 8h, 12h, 1D, 2D, 3D, 4D, 5D, 6D, W , 2W
I have put a great deal of effort into creating this, which I originally intended for personal use. It is not perfect, there are known bugs and pine-script limitations however as it is open source I invite you to share any solutions you may find to the errors you incur.
⭐️If you find some value from this, show some love with a repost or comment so it can reach more people.
---
Known issues:
**In replay only functions when time frames selected are = or < timeframe the chart is viewed in ( pine-script constraint )
**On HTFs can encounter runtime errors in replay. Toggling labels will refresh script and fix this.
Mitigation % selector for 2x+ blocks can be hit and miss.
⚠️If you encounter any other issues, first open and close trading view. If it persists feel free to drop me a DM and I will take a look!
English
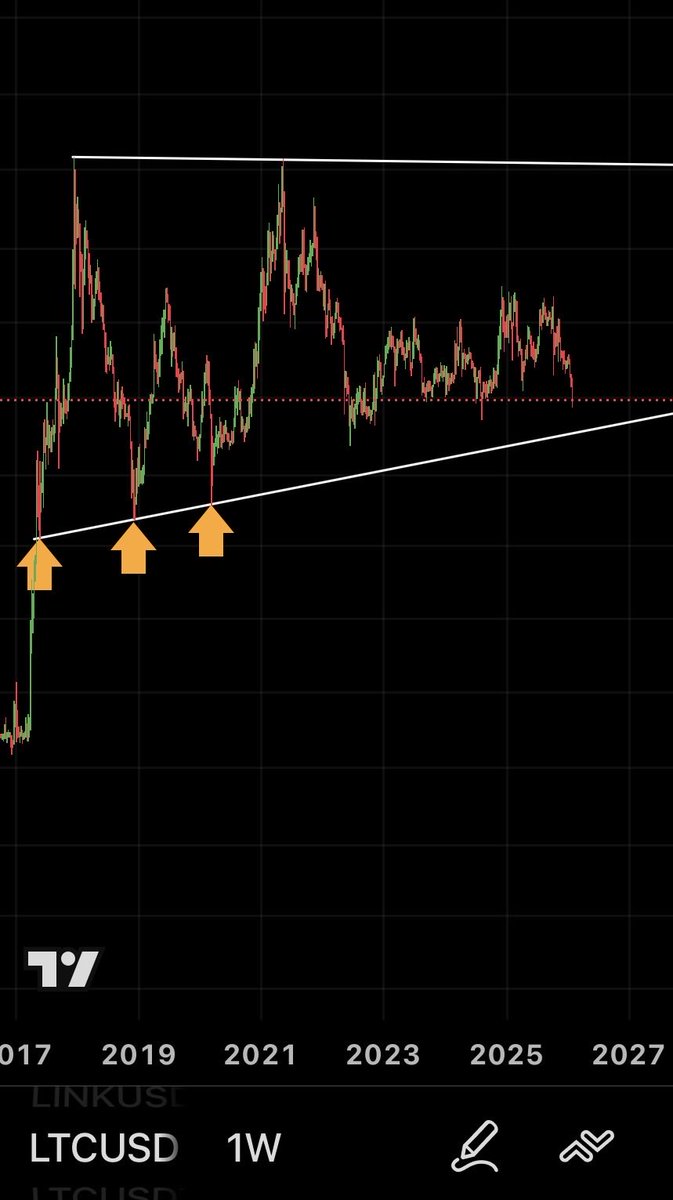
In 2020 #TOTAL3 sat around $27B and ripped to $1.13T by November 2021 — a 3980% surge. That was a 39X move in under two years. Do you genuinely think #Crypto has another 39X that fast from here? Or will this cycle be different? What’s your target this run? 👀#Altcoins #BullMarket
English
@TheocharousH @SecWar @PeteHegseth @GreeceMFA @Hellenic_MOD @WhiteHouse @POTUS @SecRubio @USEmbassyAthens @StateDept @USNATO As they have another choice 😂😂
English

GREECE, A TRUE FRIEND AND RELIABLE ALLY OF THE US WELCOMES USS GERALD R. FORD TOO🚨
After the UK’s NO to Trump, Greece not only said YES for @usairforce to use its airports, today another YES to @USNavy.
Greek friendship & hospitality at its best.
A friend in need is a friend indeed
English


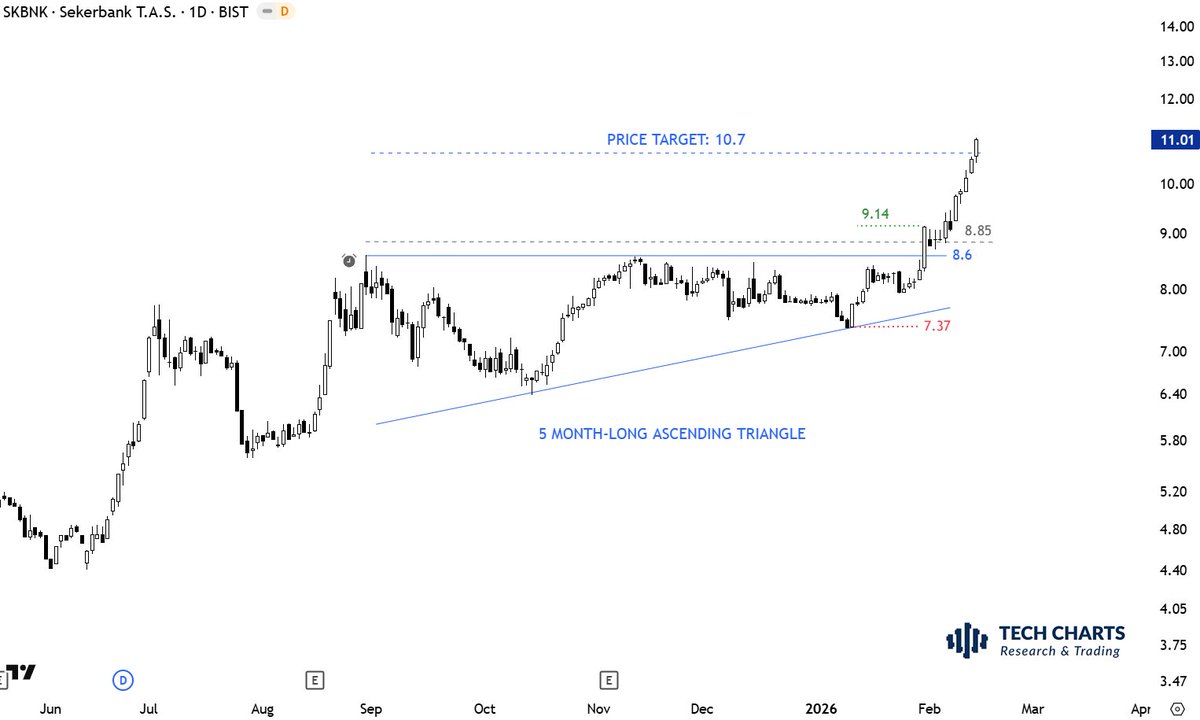
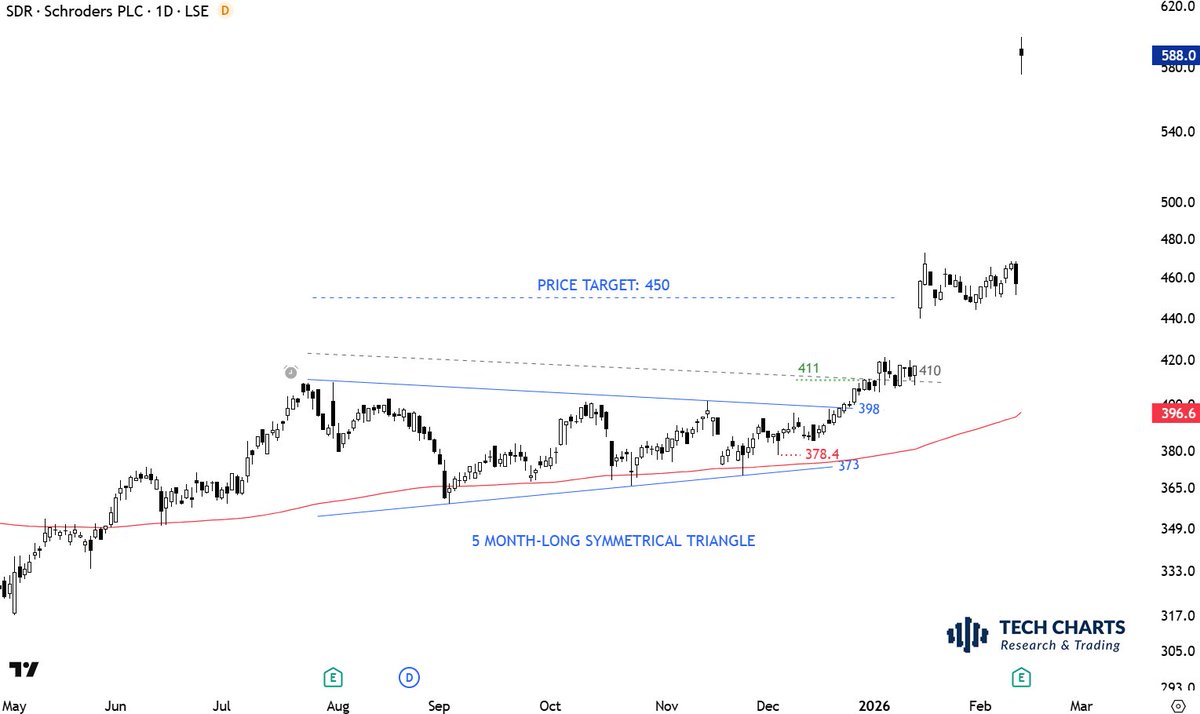
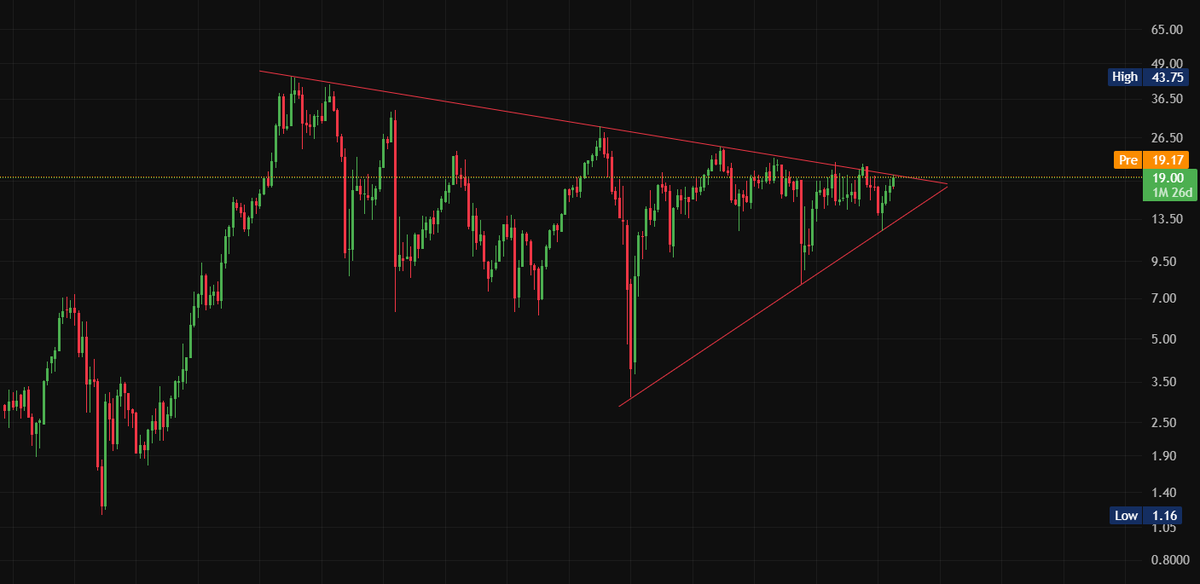
When I saw this pattern I decided to publish an #INTERIM #UPDATE for our members. It was too good to miss the boat.
#ASCENDINGTRIANGLE is a bullish chart pattern.
Here is an #interactive #blog #post where you can learn about different types of triangles. Test your knowledge on questions with instant feedback.
blog.techcharts.net/2022/09/26/tri…
English
@TechCharts Which platform are you using for BIST trades?
English

@TechCharts HST seems to be developing something similar but it has failed in 24
English

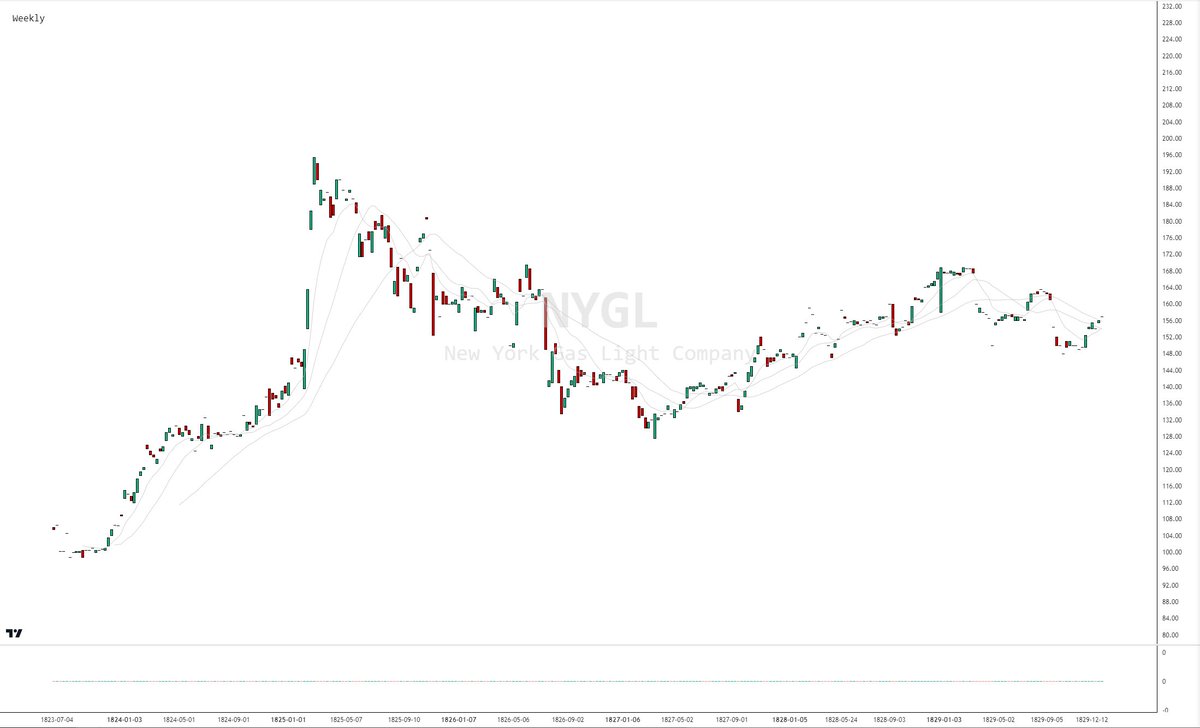
I’m excited to announce that I’ve teamed up with @IntlSpeculator to build one of the most comprehensive historical US stock market databases ever attempted.
We’re collecting daily equity data from all major US stock exchanges back to 1815, well before the CRSP era.
Most existing datasets before 1926 are weekly or monthly (often without full OHLC). Daily data prior to the mid-20th century is extremely sparse. Our goal is to reconstruct that missing history as rigorously as possible, and to do so with full OHLC candles where possible.
We'll be working with professors at leading US universities to ensure our methodology meets a high standard of academic scrutiny and historical accuracy.
We’ve already catalogued 1815–1829, with OHLC reconstruction becoming possible from ~1828 onward (earlier years rely primarily on bid/ask quotations).
Below is a weekly chart of the New York Gas Light Company from its IPO. NYGL has the distinction of being the longest continuously listed stock on the exchange. Today it's known as Consolidated Edison $ED. It was the first gas company to list on the exchanges and was immediately one of the most popular issues traded at the time of its listing in 1824.
As the database develops, I’ll be sharing charts, anomalies, and insights from early US markets here.
For deeper historical dives, I write more on my Substack:
@barrybivingston1" target="_blank" rel="nofollow noopener">substack.com/@barrybivingst…
English
English

@TechCharts $BOXL developing something similar unless I totally misunderstood your concept 🤔
English
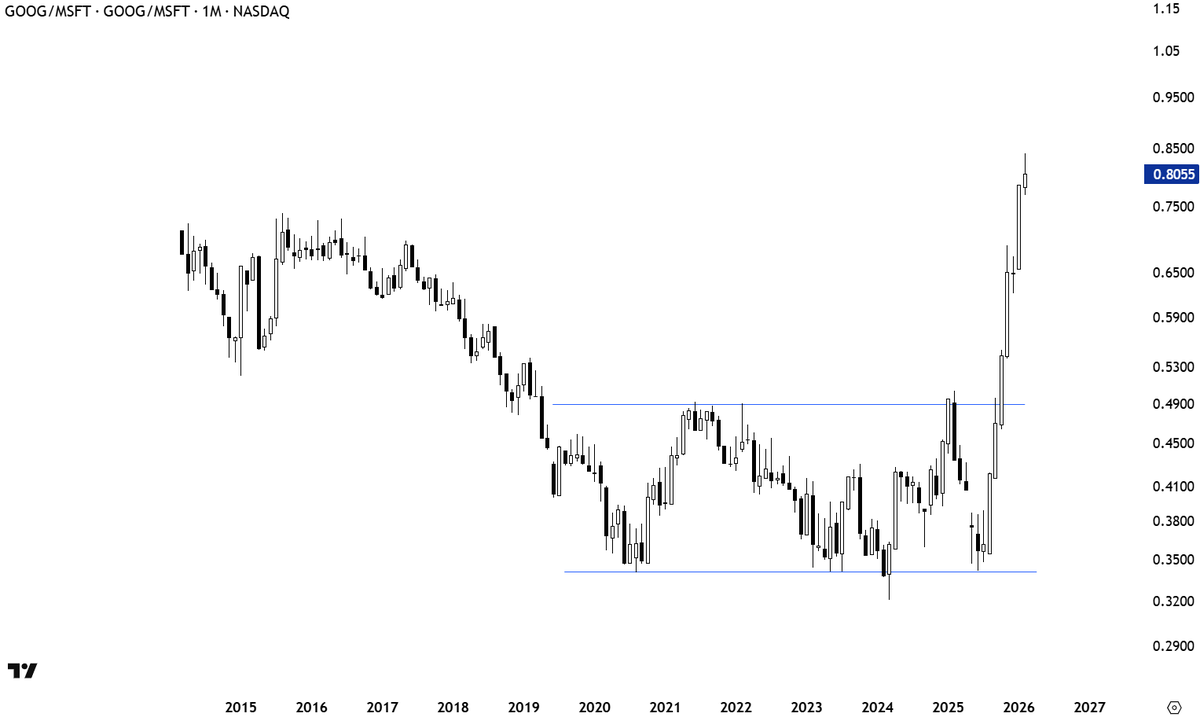
Long $GOOG short $MSFT, do you see the signal from classical charting perspective?
Fund managers, are you with me?
Aksel Kibar, CMT@TechCharts
$GOOG vs. $META similar to price charts, patterns do not always/frequently present themselves as opportunities. They are rare. But needs constant monitoring. Because when the setup presents itself, you need to be on top of it to act. Was that a flat range breakout?
English
@TechCharts I started watching your #YouTube channel recently and I really like your trading strategy. It is good to find solid resources like yours for people who wants to learn more and improve their trading skills
English
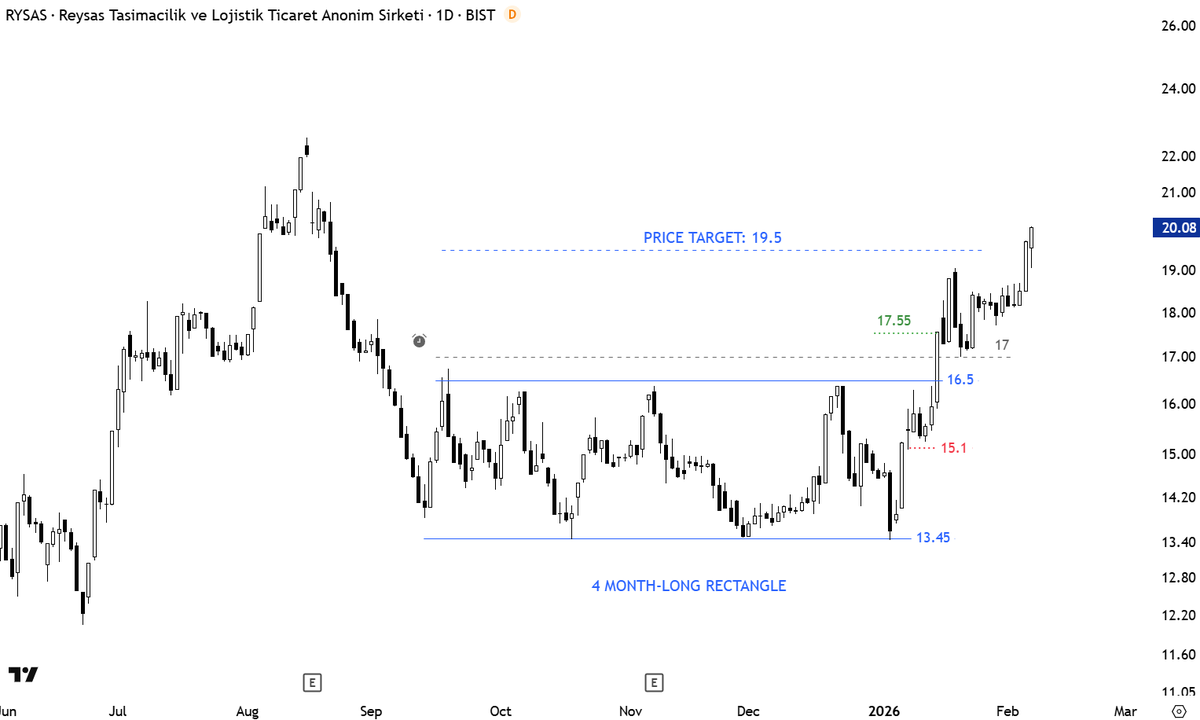
#TECHCHARTSMEMBERS $RYSAS met its price target. #rectangle bottom reversal. Breakout, pullback and continuation.
English

I wish @Trading212 had better interface for browsing stocks rather than going into each category. Why can’t we browse all the #Nasdaq lists as a single list? Why can’t we sort it by change? 🤔🤷
English