

Jay
317 posts

Morgan Housel has sold 10 million books, and Tiffany Fong makes $25,000/month sh*t posting on X.
I have some catching up to do. Oh wait, I forgot, we're not supposed to compare ourselves to anyone.
English
English




@CFlanders7 How does one fully trust a rally? This is something I struggle with as well, always think market is too extended and pullback is coming. Maybe just KISS and follow some simple heuristic like 10 above 20 and both sloping up?
English

Mistakes I made in 2019. Don’t believe the rally is for real. Hesitate and don’t take the first few names breaking out. Try other names with excessive size to make up for the gains I should have had. Market pulls, get stopped out on some, sell or reduce the others due to pressure . Size even more on the next round of names to make up for what I should have been up in the first and second round of names, rinse repeat. Have a few early leaders start flagging, size in expecting a break out. Stop out, end up trying 3 more times inside the flag. They all stop out, each one I sized with more and more risk.
Hit risk limits for the month at various points in the rally, keep trading with larger size to dig myself out. How can i stop trading when the rally is so strong?
At the end of it, was down around 30%. If I had followed my risk rules, year would have been down less than 10% (I’d have to go back and check to get exact numbers). More importantly there would not have been the spiraling and I could have likely salvaged a profitable albeit disappointing year.
English

I had $LWLG day one and botched the trade a few days later with a non structural stop.
TSDR Trading@TSDR_Trading
$LWLG incredible move. Make it part of your process to track HVE/HVC candles. Also, take note of the candle structure and location that started the advance on 4/2.
English
@Clement_Ang17 How does the ORB and 6/20 orders work? Can you do it anytime? For example set up 1m ORB in premarket, or 15m ORB 4 minutes after market open?
English

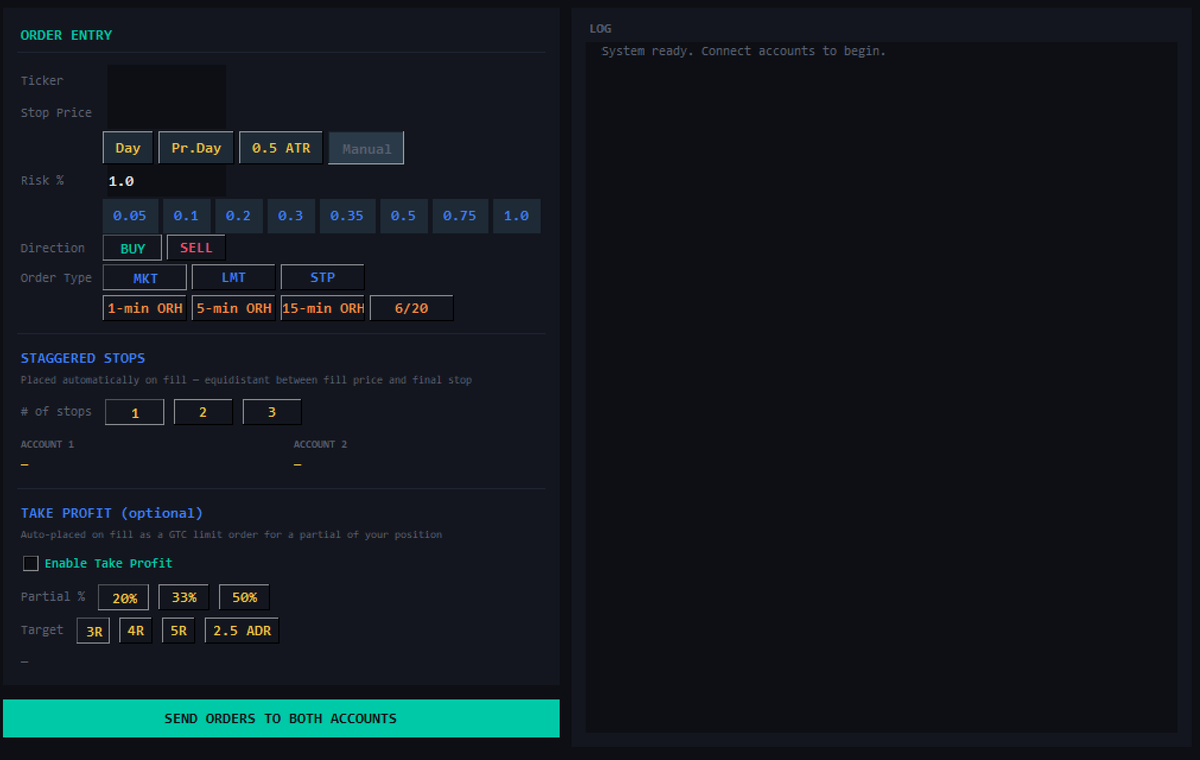
The main features for what I built is to have the tool:
(1) Automatically calculate position sizes based on my specified stop loss level and risk to equity.
(2) The option to create 2, or 3 staggered stop loss levels.
(3) Opening range style entries for momentum markets.
(4) Automatic take partial levels to further push my execution to becoming more systematic.
It looks something like this - a pretty simple tool that addresses my execution needs in trading. Hope this helps!
Jamil Muna@Jamilmuna
Hey Clement, I was thinking of doing the same. Mind sharing a little more what you automated? All good if not, no pressure. I'm thinking of getting a lower timeframe, and tight stop loss system going. A simple bot, but when I tried in the past with IBKR execution speed left a lot to be desired. Thanks in advance!
English
@BornInvestor Do you factor in holidays when doing analysis on volume? I've missed setups before where we had low volume on holidays and normally with the chart I'd think it might breakout but I passed due to it being holiday. SNDK and BE on Jan 2nd this year for example.
English
Regardless of what happens in the market this person is incorrect. If you actually study and go back through previous bottoms you will see many of these days and low volume drift up.
The post below repeats a common mantra that people just believe and repeat without any actual study or basis.
English
@traderwillhu Cool man, would be nice if we can get lower time frame replay on the breakout day
English

Thanks to AI coding, a complex learning process is now much simpler. I filtered the top 7% YTD stocks from 2000–2026 (including delisted ones), get 1400+ stocks, and visualized them with TradingView Lightweight Charts, featuring auto-marked highs/lows and direct period displays. Browse by year or symbol, even delisted stocks from the last decade like $LVGO and $TWTR are fully accessible.
Once I refine the charting and annotation features, I will open-source this learning project.
Will Hu@traderwillhu
The Path to Trading Mastery: Research and Pattern Recognition By Qullamaggie 1. Step-by-Step Market Research The easiest way to start is to research the markets thoroughly. First, get a platform like TC2000 and set your charts to the monthly timeframe. Create a watchlist of all US stocks and filter them by dollar volume instead of just share volume. Aim for liquid names—those with at least $1 billion to $10 billion in monthly dollar volume—to avoid "super thin" or illiquid stocks. 2. Identifying the Big Movers Go through the entire database (roughly 5,000 stocks) and identify the outliers. Look for stocks that: At least doubled in price within six months. Increased 200–300% within a single year. Gained 400–500% over three to four years. Create a separate watchlist for every single stock that has made these massive moves. You will likely end up with a few hundred highly liquid, historical winners. 3. Studying Chart Patterns Go back as far as the 80s or 90s and study their chart patterns. Stocks move in very specific ways. These same patterns occur over and over again—there is nothing truly new in the markets. While there are variations, the patterns that worked in the 90s are the same ones you see today. Focus primarily on price action. You can add a few indicators if you wish—I recommend moving averages—but don't use too many. "Too many indicators is for suckers." Study how these big winners acted during pullbacks: Which moving averages did the best stocks respect or "obey"? How did they behave before the breakout? How did they act once the move was underway? 4. Building Your Mental Database (The 2,000-Hour Rule) Your goal is to build a database in your head. Spend 1,000 hours doing exactly this: printing out charts, studying them, and saving them. (I personally use Evernote to store tens of thousands of these charts). Once you understand the price action, spend another 1,000 hours researching the fundamentals and the news behind those moves. What was driving them? What made a stock go up 500% in a year? If you put in those 2,000 hours of deep research, I promise you: before you know it, you’re going to have ten million dollars in your account.
English
@BornInvestor Did you catch $RLMD right when it retook $6? I have trouble catching these that show weakness in first half but then later turn around. Caught $XENE though.
English
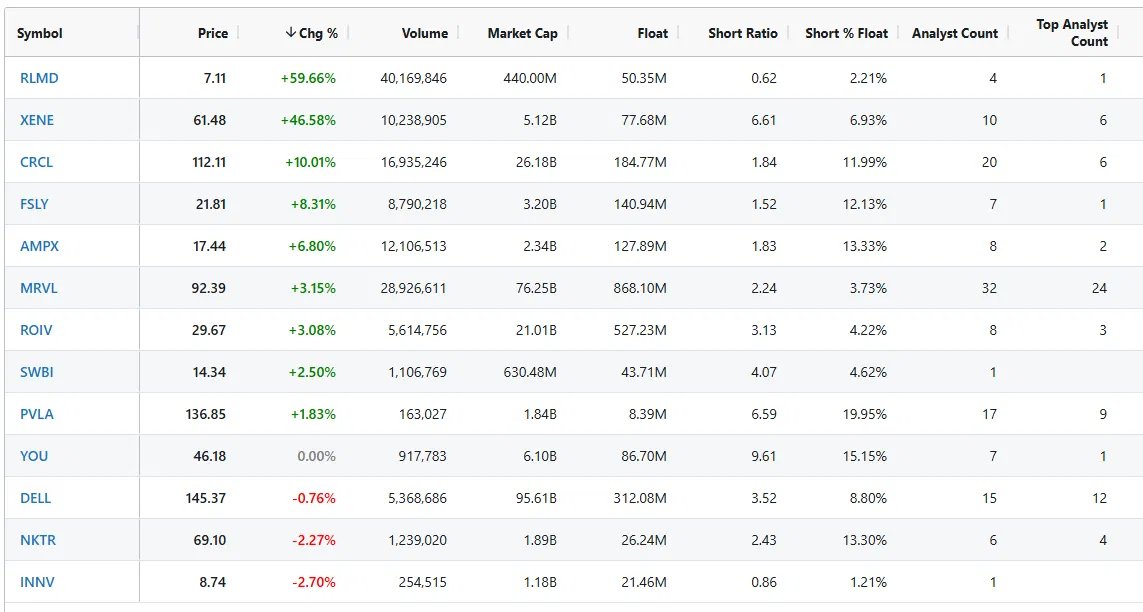
Positions Overnight - $FSLY, $DELL, $CRCL, $SWBI, $INNV, $MRVL, $RLMD, $NKTR, $AMPX, $PVLA, $XENE, $YOU, $ROIV
English
English

Donald Trump on AI:
“There’s this thing that just came out. Perplexity Computer. Heck of a product. Just came out last week.
We were able to do a little thing called VIBE CODING — powerful thing, incredible technology btw — to monitor the situation and target the AYATOLLAH of Iran. One of the greatest achievements of my administration and it’s only $200/mo can you believe it? Marco is going to go wild with this thing when we refocus on Greenland, believe me.”


English

@ericjackson Please use your own words, that’s why I follow. This is give away. “This isn't a blip. It's a generational collapse.”
English

Canada's GDP per capita was 94% of America's in 1981.
Today it's 67%. The widest gap since World War II.
Ontario — Canada's economic engine — is now poorer than 43 US states. Including Louisiana and Alabama.
This isn't a blip. It's a generational collapse. Here's the data:
From 2017-2024, US productivity grew 10.1%. Canada's fell 0.6%. America is sprinting. Canada is walking backwards.
71% of Waterloo software engineering grads leave for the US. The brain drain damage threshold is 20%. Canada is at 3x the red line.
Israel spends 6.35% of GDP on R&D. The US spends 3.4%. Canada spends 1.7%. That's not a gap. That's a different species.
Canada's pension funds hold $2.6 trillion. Only 13% is invested in Canada. 47% is in the US. Even Canada's own money doesn't believe in Canada.
Net FDI position: negative $1 trillion. Capital is fleeing the country faster than Waterloo grads.
72% of Canadian entrepreneurs start businesses because "jobs are scarce." Not opportunity. Survival.
Canadian workers get 30 cents of IP investment for every $1 an American worker gets. You can't out-innovate anyone with 30-cent tools.
The average Canadian spends 48% of their income on a mortgage. The average American: 34%. Canadians work to pay for houses. Americans work to build companies.
None of this is about laziness. Canadians are talented. The system is broken.
Zero income tax. Business-friendly regulation. Speed of execution. That's Dubai. That's Singapore. That's what "Dubai of the North" means.
Canada has everything — talent, resources, geography, rule of law. What it doesn't have is a system that rewards building.
Fix the tax code. Kill the red tape. Stop subsidizing real estate. Start subsidizing R&D. The talent is there. The capital will follow.
English

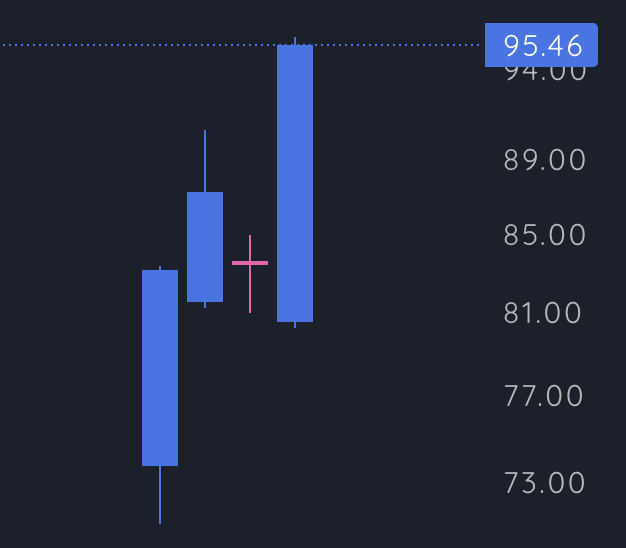
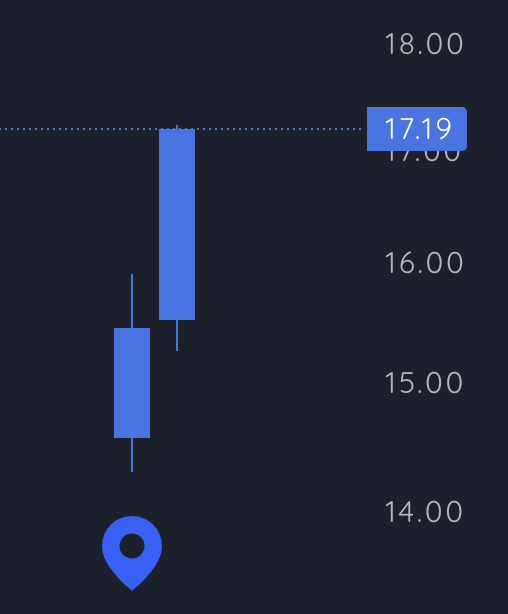
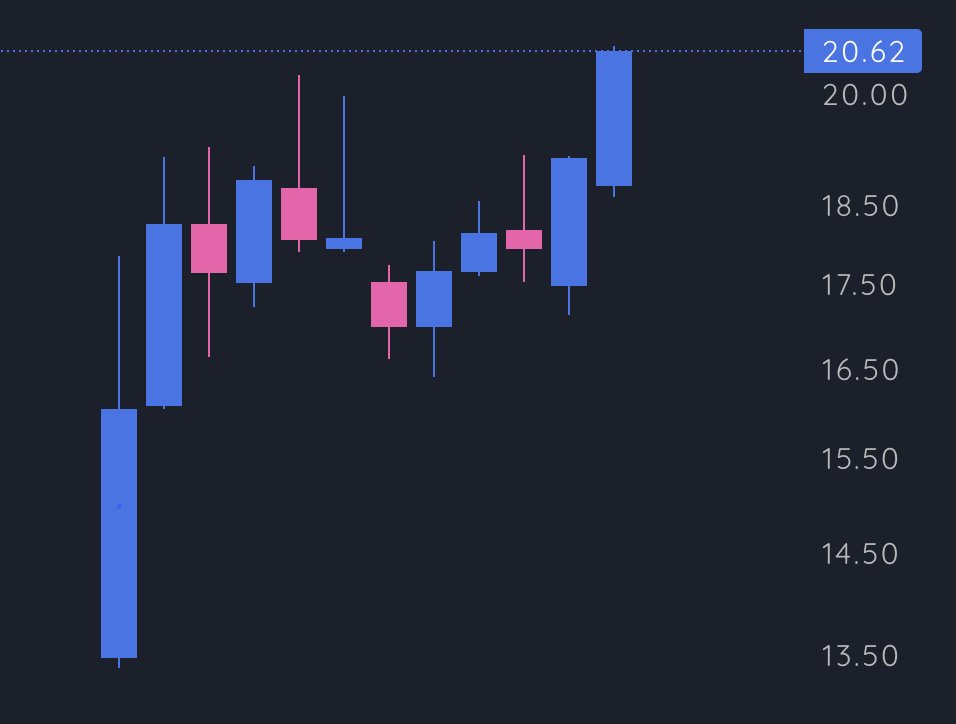
$CRCL $FIGS $FSLY all have something in common.
The basic analysis is they gapped up on big volume
$CRCL - Highest Volume since IPO
$FSLY - Highest Volume Ever
$FIGS - Highest Volume in 1 Year
but what makes them special is each gapped up on the charts into key Whole Numbers which increases probabilities exponentially.
$CRCL - $80
$FSLY - $15
$FIGS - $15
once you study this nuance of your edge you then know what to position size big on and what to ignore even when you think an edge maybe present.
English
@anandragn Nice app man, could you share the APIs you use to get the data?
English

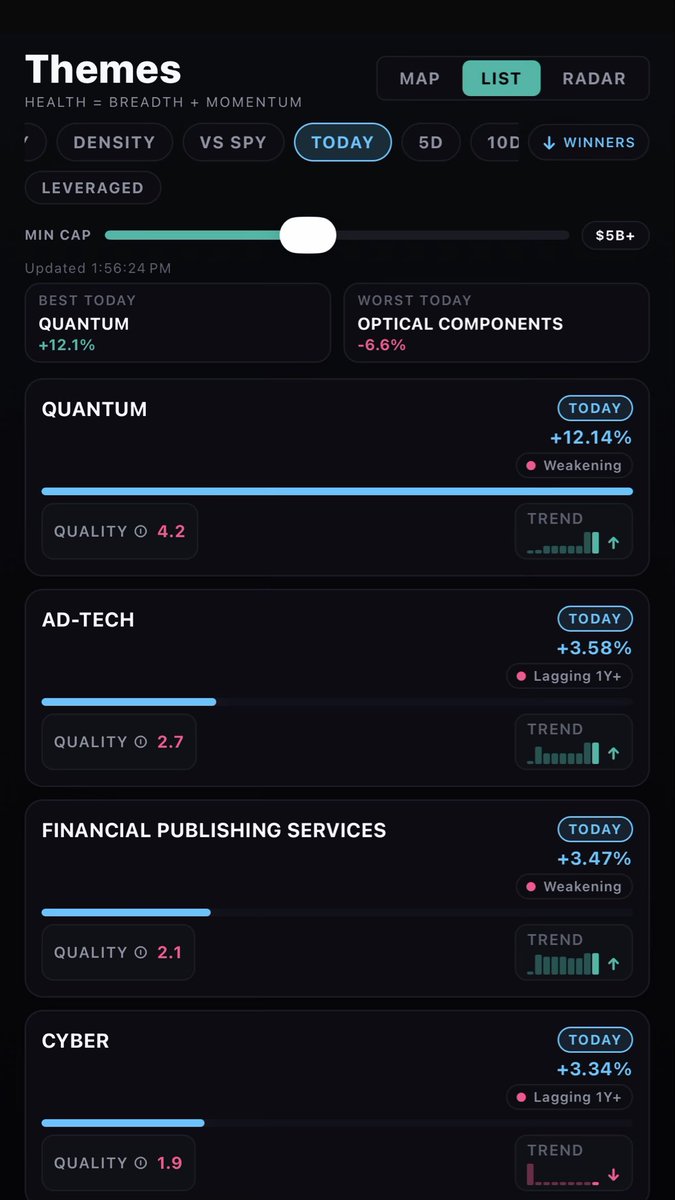
@BornInvestor I see, fair point, definitely not 5 stars by any means. I liked how it built a solid range with higher lows with all MAs compressed
English
@longmomo_ I felt like weekly chart was too short a base vs the drawdown. (was like a bear flag). Seems i was wrong though it may just stall out here at $4.
English
I passed on $IOVA and $LRMR yesterday. Two Biotechs. The latter is squeezing like crazy today. Oh well. Can't catch them all.
English
@ericjackson “That’s not volatility.
That’s duration collapsing”
Tired of reading everything in Gemini’s written tone…
Please use your own writing style. I don’t know which words are yours vs AI.
English
Everyone keeps saying IGV is “6 standard deviations oversold.”
Maybe.
But IGV has never faced this before.
A Claude blog post → cybersecurity down double digits.
A COBOL comment → IBM has one of its worst two-hour drops this century.
That’s not volatility.
That’s duration collapsing.
For two decades, enterprise software traded like an annuity:
Predictable cash flow.
Expanding multiples.
Perpetual relevance.
AI doesn’t just compress multiples.
It compresses belief.
The market isn’t asking what CRM earns next quarter.
It’s asking if CRM owns the end state.
That’s a different kind of doubt.
Yes, someone will sell the agents.
Yes, incumbents can adapt.
But when cognition gets cheaper, every workflow becomes contestable.
Everything.
You can’t value that with a rear-view mirror.
In this regime, passive exposure feels safe…
until it isn’t.
Structure beats comfort.
Governance beats hope.
This isn’t “oversold.”
It’s the sound of the future negotiating its price.
And some people are still trading yesterday.
English
@BornInvestor I see, the full first minute candle was ~20% of avg daily vol, you're saying you entered as soon as it reached 10%?
English
I didn't expect a fade I was just aware that it has a habit of doing that. But yes. 10% of Daily Vol in 1st min so I entered on first candle. I would change my opinion in the moment. Sometimes I'm looking for pullbacks and a stock just goes so I will make a call whether to take a shot or not.
English
$AEHR the second pick in Newsletter today. This stock has a habit of fading but nice setup, nice chart and in Theme. Would prefer a close above $35

English
$HIMS and Ro remind me of this:
There is an old joke about a policeman who sees a drunk man searching for his keys under a streetlight.
"Did you lose them here?" the officer asks. "No," the man says, pointing into the darkness. "I lost them in the park. But the light is better here."
Investors do this too.
We analyze public companies because the data and the buy button is there.
This triggers adaptive preference formation, also called the sour grapes bias.
Because we cannot easily invest in private competitors, we subconsciously convince ourselves the private business isn't as good, and the public company will be the category winner.
By being aware of this bias, we can actively check ourself and do proper due diligence.
Note: Not claiming Ro or Hims is the better company, but since $HIMS is public, and Ro private, investor psychology will lead to (as Keynes put it) Castle in the air building for Hims, while largely overlooking Ro.
English
@longmomo_ I used cursor to do the coding and the main library i used is PySide6. Stock data is downloaded via schwab API.
English

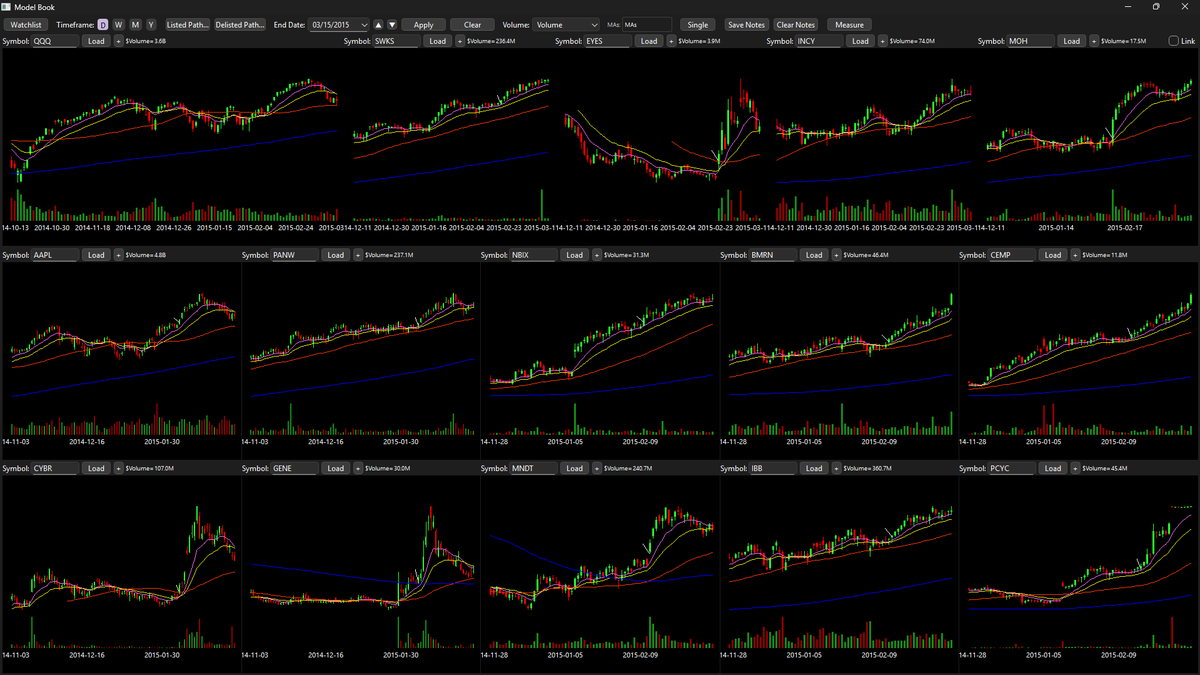
2015 was definitely a hard year. However I think there was a multiple periods that had good moves that could've made your year.
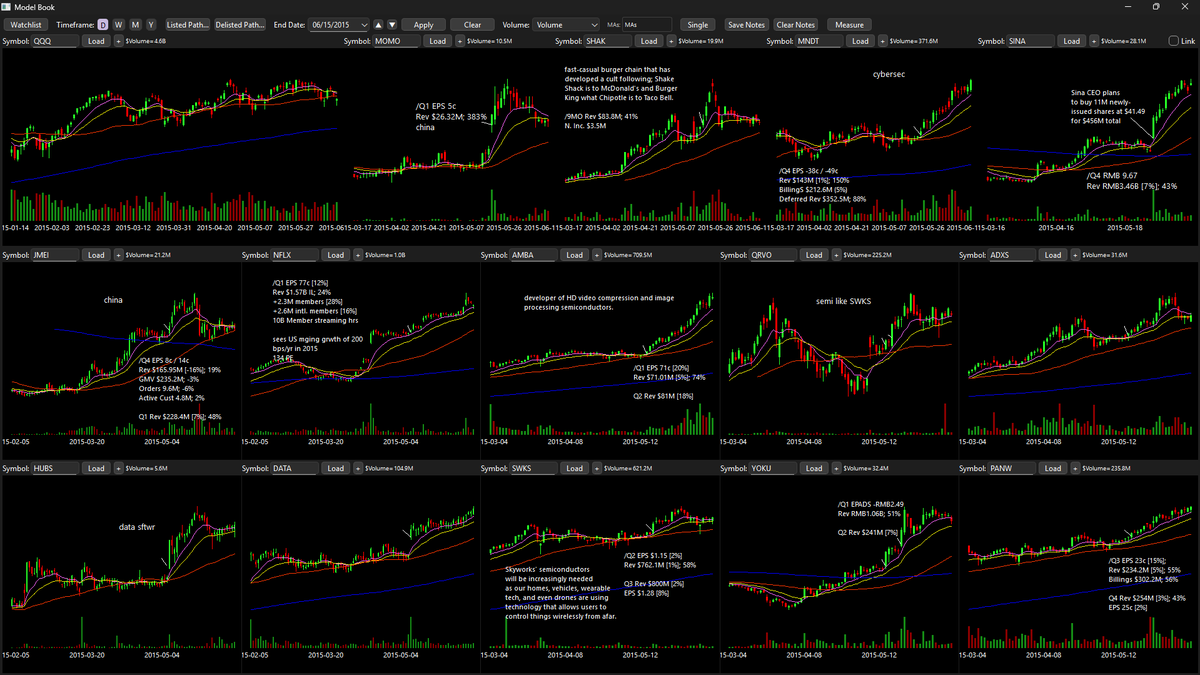
The February rally had some nice moves in biotech and cybersecurity, which were the 2 major themes at the time.
2/10: AAPL CYBR PANW GENE NBIX
2/12: MNDT BMRN
2/13: IBB CEMP
2/19: PCYC
2/20: SWKS HZNP
2/24: EYES
Then in May, while the indices mask it, there was a few week push in leading names, most notably China, which at that point became the #1 theme. Biotech, Cybersecurity, and now Semi's were some of the other themes that were relevant at the time.
5/7: JMEI HUBS
5/8: NFLX DATA
5/14: AMBA SWKS QRVO YOKU
5/15: ADXS
5/18: PANW
5/19: MOMO SHAK
5/21: MNDT
5/29: SUPN HRTX
6/1: SINA
6/3: OSPN
Then the rally from mid-to-end of July had some fantastic moves in large-cap leadership like AMZN NFLX META, along with some biotech ACAD SRNE PGEN (and SCO, oil short).
Zanger on July 17th even said "Stocks are soaring like it's 1999 again with moves as large as any seen during the dot com bubble. With gains of $60 to $150 in just under a week, established companies like Google, Netflix, and Amazon are among the strongest movers."
I feel like AI LLM's still give far too general answers on summarizing markets, especially with such a specific system like CANSLIM where we aren't really trading the "market" but a very small, specific batch of growth momentum leaders.
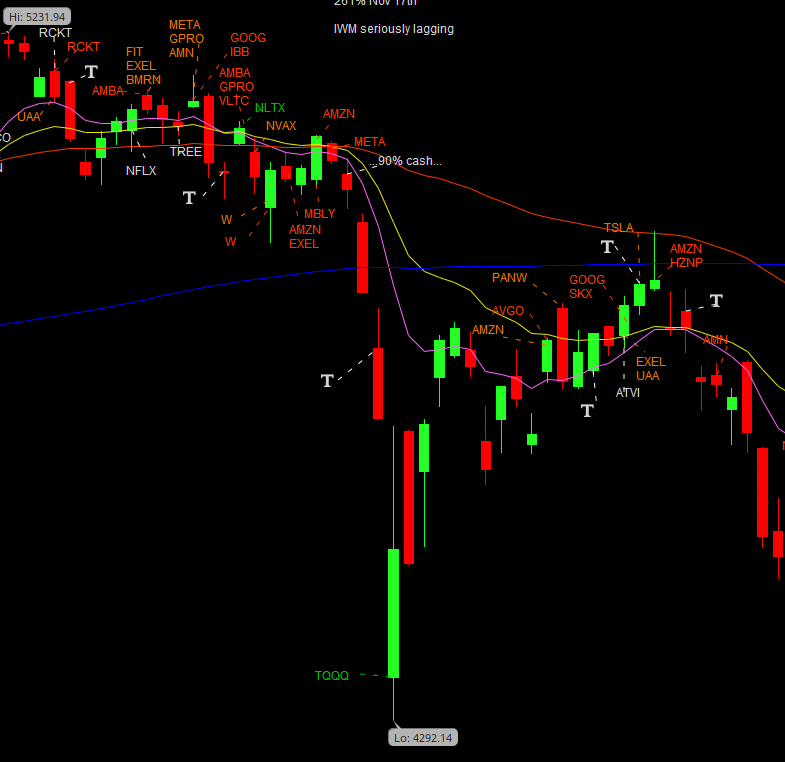
Now that I'm looking at my notes, I August/September was probably one of the worst months of the year in terms of opportunity. Pre-waterfall decline is filled with setups that led to breakeven/losing trades, and after the parabolic long setup on the indices which was admittedly a decently fat pitch, the setups in the leading liquid leaders for all of September led to breakeven and losing trades. Only winning BO that I found at that time was ATVI.
Tier 1 META AMZN GOOG NVDA TCOM ATVI
Tech PYPL NFLX EXEL FIT TREE LNKD BKNG TCOM
EXPE HUBS ADBE
( check for yourself :D )
From October to EOY, despite what looks like a powerful market rally, it was relatively uneventful when it comes to the actual tradable universe imo (another reason why indices cant be the only proxy for determining mkt conditions).
Beside catchable moves in AMZN META, the rest of the moves in the leaders was characterized choppy, sloppy, and sluggish action where most trades ended up in breakeven trades or to stop you out just to grind higher.
But instead of taking my opinion, you can just check for yourself, heres my Universe Summary at the time for Q4 2015:
Tier 1 META AMZN GOOG NVDA TCOM ATVI
Tech PYPL NFLX EXEL FIT TREE LNKD BKNG TCOM
EXPE HUBS ADBE
Semis CRUS AVGO MXL IPHI
China BABA NTES TCOM BIDU QUNR SINA
Retailer NKE SKX UAA
Randoms - PACB NHTC PLNT XOMA AVXL WW
Biotech falls off a cliff; IWM seriously lagging
IMO, the Feb and May rally was the easiest money environments, with mid July being decent. Everything after that was...bleh.
credits to @traderwillhu for the Model Book tool :)
Clement Ang@Clement_Ang17
This was the market in 2015, and 2016 was not exactly smooth sailing too. The big opportunity came Aug/Sept of 2015. From Grok: Sector Rotation: A Core Similarity Current Market (2026 YTD): Early 2026 has been marked by significant sector rotation away from mega-cap technology and growth stocks toward cyclical, value-oriented, and defensive sectors. This aligns with your description of a "challenging" environment with "a lot of rotation." Tech has underperformed (down ~0.4% YTD in January), while energy, materials, industrials, and consumer staples have led gains. This broadening of leadership is seen as a reversal from 2025's AI-driven tech dominance, where large-caps outperformed small-caps by a wide margin (19.78% vs. lower returns for small/mid-caps). Comparison to 2015-2016: 2015 was a flat, volatile year with defensive rotation (e.g., consumer staples and health care outperformed amid global concerns like China's slowdown and oil price crashes). Energy and materials lagged severely. 2016 saw a sharp rotation into cyclicals as the market recovered from an early-year selloff, with energy, financials, materials, and industrials leading. This broadening helped drive overall gains.
English