
StellarCapitalist
64 posts

@STLRCap @CEOStockWatcher Shantanu is in his 60s and is retiring lol. Really not advocating anyone buy Adobe, but I can say Shantanu selling his shares as he enters the next chapter of life is NOT the reason for my pessimism.
English

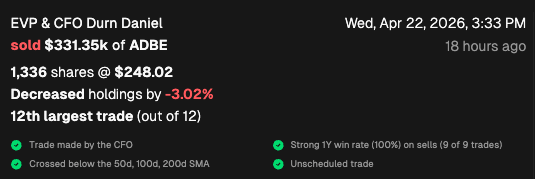
Adobe $ADBE CFO selling $330k even with the stock down 30%
English
@CEOStockWatcher @DetroitBengals Yea and now the CEO sold a cool 18 million. Options or not, if he thought the stock was severely undervalued he would wait to exercise. If the CEO doesn't believe in it, why should I?
English
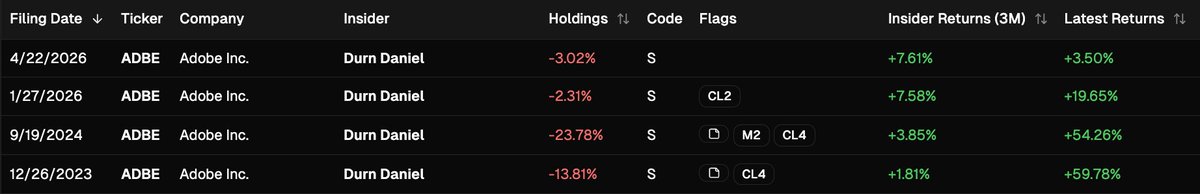
I do agree that it is common for execs to sell their awarded shares (which is why I tend to ignore insider sales at tech companies), but you'd normally see 1) the selling happen on the same filing as the stock vesting and 2) the same selling pattern every year (which we flag as a *scheduled* sale)
But for the Adobe CFO, you can see his selling is fairly random
Note: I don't think this selling is some huge red flag by itself, but he did pretty conveniently sell almost the exact top in both 2023 and 2024
English

@mply_cap I like it at low teens range. $900 would be a steal for $fico.
English

Applying $FICO average forward P/FCF of 35.17 to FY2025 EPS guidance of $25.05 implies a fair value around $881. Even after the drawdown, it trades at $1,620.
That said, this valuation is simplistic for a near-monopoly with 80%+ gross margins, 44% operating margins, strong free cash flow, and deep integration into the credit system.
I already own $SPGI and $MCO, so there’s no urgency for me. I’d consider starting a position closer to $1,000.

English
@realroseceline It will end up like the airlines. They all have their own apps. People still book on aggregators.
English
Thoughts on $UBER
I have been studying $UBER more deeply for several weeks. Pundits and proponents say it’s either an unstoppable global platform with massive network effects, or it’s a commoditized ride app with no moat and permanent margin pressure.
The bull story is easy to tell because $UBER finally proved it can generate real free cash flow, something it struggled with for a long time. That alone correctly changed the narrative because mobility and delivery are not loosing miney anymore. The scale advantage is huge and the brand is global. As volume grows, $UBER becomes more efficient, (ie matching improves, margins expand, etc).
If that continues, earnings can compound at a decent rate. If autonomy ends up working “through” $UBER rather than “around” it, the upside can be interesting because $UBER becomes the demand aggregator for fleets it doesn’t even have to own. Yes, quite appealing indeed.
That’s the optimistic version, and it’s not crazy. But bears say ride sharing is fundamentally a logistics marketplace, and logistics businesses historically do not have large margins. If growth slows and pricing gets competitive (again), margins can fluctuate down quickly. Autonomy is a double edge sword because it can help $UBER, or it could hurt it if supply explodes / becomes commoditized. This scenario doesn’t require total disaster, it just requires “pressure”.
What makes this interesting isn’t whether $UBER survives, it almost certainly does because it’s a massive global platform, etc. The real issue is whether incremental returns from here are attractive. $UBER today is not a turnaround or a broken IPO story. It’s a scaled platform that now has to prove that the economics are durable and improving.
And then there’s the most important part many people skip, which is “expectations”. Stocks don’t move because a company grows. They move because reality diverges from what the market already assumes. If the market already expects steady margin expansion and certain growth, then simply executing the base case may not be enough to generate outsized returns. This is not $UBER specific, it’s a truism for any equity. On the other hand, if investors are underestimating how profitable a model can become at scale, there could still be room for attractive returns, perhaps even more vast than initially meet the eye.
So when I think about $UBER over five years, I’m not asking whether rides will still exist or if revenue / bookings grow. Of course they will. I’m interested in the much more complex question of whether the return on capital from this point forward is high. And, whether margins structurally improve, and if so, by how much? Or do they deteriorate?
It’s been an interesting and honestly somewhat complicated business to study. The surface level story is easy, revenue grows, bookings grow, usage grows, but that’s not what really matters, at least in my humble opinion.
To me, the thoughts outlined above are asked far less often, yet they are the ones that actually matter. The question isn’t whether revenue keeps growing, it probably will. The real question is whether the economics from here improve, how much margins can expand, and whether the return on incremental capital ends up being meaningfully better than what the market already assumes.
It’s much easier to post charts all day with lines that move nicely from the bottom left to the top right. But the harder, less flashy questions that serious investors should be focused on are the ones above, the durability of margins, the sustainability of returns, and whether the capital being deployed today will actually earn more than what’s already priced in.
TGIF!
🌹
English
@QualityInvest5 @fiscal_ai @meetblossomapp @meetblossomapp has nothing on their website about how they make money. They say its free. I see there is a paid tier. Is that it? Do they sell data? FAQ is pretty sparse.
English

Fiscal x Blossom
Only two companies I can say I'm a proud sponsor/ambassador of and believe in 🙌
@fiscal_ai @meetblossomapp
Braden Dennis 📊@BradoCapital
Blossom has quickly grown to a vibrant community of over 500,000 DIY investors. I've gotten the chance to get to know the Blossom Team well and witness what they have built both on the platform and at the massive investing conferences We have partnered to provide the platform with earnings data within minutes of a company's report and core KPIs.
English
@TrueStockData1 @TicTocTick This is typically how the “it must x soon” goes.
The feeling (“prediction”) is close enough to feel imminent but far enough to feel “not quite yet”.
Truth is no one knows. Could crash next week. Could crash 3 years from now.
English
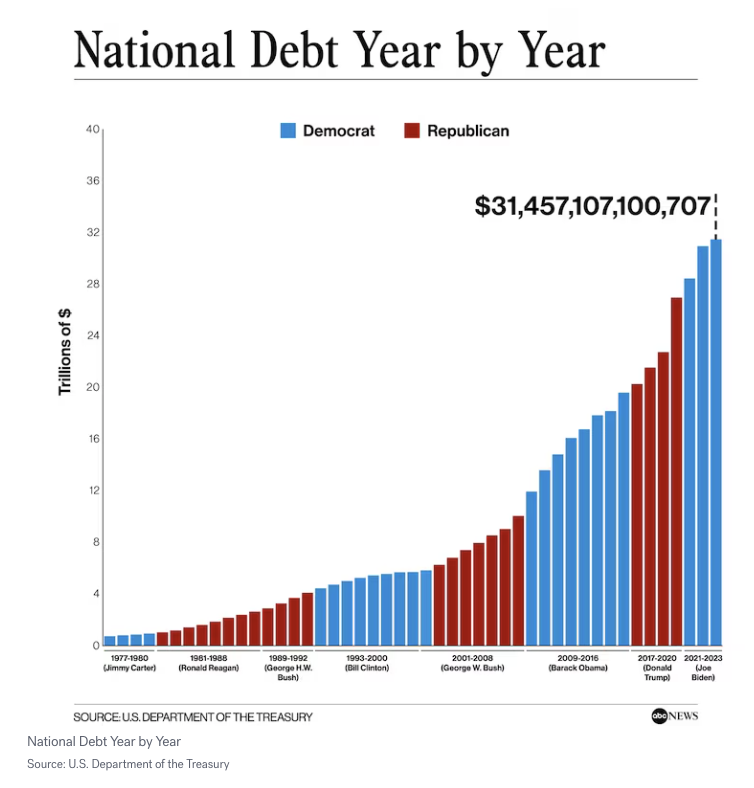
Back in the day when rates were 5-10%, the main purpose of stock market was for companies to raise capital.
Now with 0%, the stocks have become a scheme to enrich the wealthy.
The stocks are v expensive.
Idk how much higher they go but they will crash 60-70% from highs soon.
English

Actually, housing is still an awesome investment.
Let me explain.
That chart is missing leverage + tax benefits.
Let’s walk through the math step by step.
You want to buy a $1M home. You put 20% down. That’s $200K out of your pocket. The bank lends you the other $800K.
The home appreciates 4% in year one. That’s $40K in appreciation. But you only invested $200K of your own money. So your return on equity is 20%, not 4%.
Now take that same $200K and put it in the S&P 500. At 9% annual returns, you make $18K.
Same capital. The house generated $40K. The stocks generated $18K. The house wins by more than 2x.
This is leverage working in your favor. You control a $1M asset with $200K. The appreciation happens on the full $1M, but your denominator is only $200K.
Now layer in the tax advantages.
You’re paying 6% interest on $800K. That’s roughly $48K in mortgage interest during year one. If you’re in the 37% federal bracket, you can deduct that interest. That puts $17,760 back in your pocket. Your effective borrowing cost drops from 6% to about 3.8%.
Property taxes are also deductible up to the $10K SALT cap. In many states that’s another few thousand in tax savings.
Now here’s where it gets interesting.
When you sell stocks at a profit, you pay 15% to 23.8% in long-term capital gains tax. No exceptions.
When you sell your primary residence, the IRS gives you an exclusion. If you’re married and lived there two years, you can exclude $500K in gains from taxes. Completely tax-free. If you’re single, it’s $250K.
No equivalent exists for equities. None.
Let’s run a 10-year scenario.
You buy that $1M home with $200K down. It appreciates 4% annually. After 10 years, the home is worth $1.48M. Your gain is $480K. You sell, take the exclusion, and pay zero federal tax on the gain.
Your friend puts $200K in the S&P. It compounds at 9%. After 10 years, they have $473K. They sell and owe $54K in long-term capital gains tax at 20%. They keep $419K.
You kept $480K tax-free. They kept $419K after tax. And you had a place to live the entire time.
But wait. There’s more optionality in real estate that stocks don’t offer.
If you convert your home to a rental before selling, you can use a 1031 exchange. This lets you roll your gains into another investment property and defer taxes indefinitely. Your $480K in gains moves into a bigger property. No tax event. You can keep doing this your entire life. Some people die with millions in deferred gains that pass to heirs at a stepped-up basis.
Try doing that with Apple stock.
You can also depreciate rental property on a 27.5-year schedule. This creates paper losses that offset real cash flow. You collect rent, but the IRS lets you report a loss.
Stocks offer no depreciation shield.
Now consider forced appreciation. You buy a dated home, renovate the kitchen and bathrooms for $50K, and add $150K in value. You created $100K in equity through sweat and decisions. Stocks don’t let you do that. You can’t renovate your way to a higher share price.
The chart shows S&P 500 at 7000 vs median home prices around 2000, indexed from 1970.
What it doesn’t show is that almost nobody buys a home with 100% cash. The comparison treats real estate as an unleveraged asset class. It ignores that a 4% return on a 5x leveraged asset generates 20% returns on equity. It ignores tax deductions that reduce your borrowing cost. It ignores the primary residence exclusion. It ignores 1031 exchanges. It ignores depreciation. It ignores forced appreciation.
The tweet asks why people take 6% mortgages when renting is cheaper and they could earn 9% in stocks.
Because $200K in a home generates more after-tax wealth than $200K in equities over a 10-year hold in most appreciating markets.
Housing can be an amazing investment (if you get the right land in the right market at the right price).
Michael A. Arouet@MichaelAArouet
Wow, probably the most eye-opening chart you'll see today. Can someone please explain why people take 6% mortgages to buy a house if renting is cheaper? They could earn 9%+ on their equity in the stock market instead. Double loss. Does this make sense to you?
English
@KapitalCrypto @SprinterPress Both of those statements are false.
English

@SprinterPress What am I missing here? Venezuela is a country not at war with the US or vice versa? China isn't at War with the US or vice versa.
English

"A Chinese oil tanker left a Venezuelan port on December 25th, loaded with 2 million barrels of oil, and the U.S. fleet stationed in the Caribbean Sea simply watched it go by."
English
@rektdiomedes @balajis You’re assuming they won’t just force a different denominator. Goodbye dollar, hello CBC. Your mortgage is now converted at 1:1, and you derive no benefit from your fixed rate 30 year contract that is now forcibly rewritten.
Read what happened in Weimar.
English

Real estate in US is a fully financialized asset so its price is to some extent a derivative of bond prices...
So in moderate fiat collapse money printing low rates environment it would probably do great...
HOWEVER... if we hit Russia 1990's chaos style collapse, not so much... would probably drop a ton...
Though it would still have a decent floor as long as there is at least some rule of law for titling disputes, etc and we haven't hit full Mad Max territory...
English

THE REAL VALUE OF AMERICAN REAL ESTATE
Molson asks: what's safe when fiat fails? A great question. We unfortunately have more films on alien invasions and killer robots than we do on fiat failures, so relatively few have thought through this scenario. But given that decades of accumulated borrowing is now finally coming due, it's worth modeling what happens when the dollar is debased to pay the unpayable debts:
We'll focus on the question of whether real estate is really safe in the event of an American fiat crisis, but many of the concepts apply broadly to any G7 country in the midst of sovereign debt crisis.
(1) First, the conventional wisdom is that gold, guns, and land are reliably valuable in a US fiat crisis. I'm not so sure. Gold can be stopped at TSA metal detectors. Guns are only truly useful when the state fails, in genuine Mad Max scenarios. And real estate is really not very safe in a failed state.
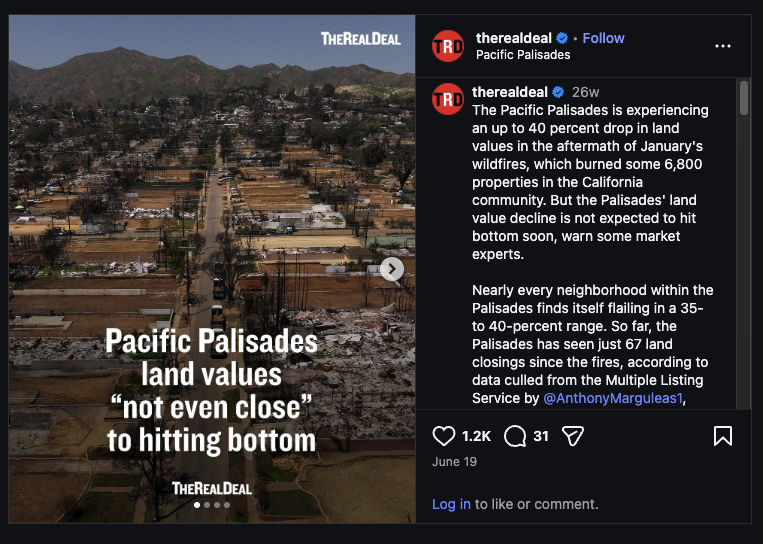
(2) To emphasize that last point: in Soviet Russia or Maoist China or Kleptocrat California, real estate is really not very safe. All the homeless encampments, illegal aliens, anti-building regulations, and squatter laws in places like California have eroded property rights. Billions of dollars in real estate lies fallow as a consequence. Add to that the corruption of a failed state that takes infinite taxes but can't stop endless fires, and you get the Pacific Palisades. Worth billions on paper, burned to the ground in practice:
(3) Much Blue American real estate is like that. Are you really bullish on New York City real estate in real terms, given its current leadership? Or Seattle, Portland, Chicago, LA, or Boston? The one thing keeping some of those economies afloat is tech money. But of course the governments of those places also want that tech money out.
(4) Moreover, there are good reasons to think real estate should depreciate in real terms. For one thing, the Case-Shiller index shows America to be at the top of a nominal real estate bubble even more insane than the 2008 crisis:
(5) For another thing, US real estate actually has been dropping in real terms, which is to say against a basket of Internet currencies and Internet companies:
(6) For a third thing, there are also significant forces (YIMBYism and the like) which want to bring real estate prices down for good reasons, by making housing more affordable by building more. This is distinct from reducing real estate prices for bad reasons, by allowing it to become uninhabitable as per the Palisades. And it's also distinct from reducing real estate demand by simply reducing the number of people emigrating to the US, which is the policy of the right. But all of those forces (libertarian, left, and right) want to bring the real price of real estate down.
(7) And that's a good thing, right? I mean...yes, in theory. But it does mean real estate may not be a good long-term store of value in an American fiat crisis, which was @Molson_Hart's original question. Neither gold (hard to transport), nor guns (only useful in Mad Max), nor US land may have that much real value in the long run. Particularly as the chaos we see online spills offline. Think the Pacific Palisades, but everywhere.
(8) And there is another wrinkle. Powerful factions (NIMBYs, boomers) do not want US real estate to go down in real terms. They want number-go-up technology applied to their house, their ostensible store of value. And like every American, they're suffering from inflation, which is boosting their property taxes without actually increasing their resale value.
(9) So the compromise "solution" may be that the nominal value of real estate goes up (via money printing) while the real value of the dollar goes down. The boomers get a high number on their house but no real value; the rest get not even that. And American real estate thus becomes more affordable if (and only if) you're outside the rapidly inflating dollar economy, by living in other countries or holding only hard currencies.
(10) That is an unfortunate forecast, but very similar to what happened in Russia in the 90s after the end of the Soviet Empire. Very little within the Russian system was really safe. Safety came from getting outside the system, from exiting the failing system.


molson 🧠⚙️@Molson_Hart
Imagine a country where the monetary system fails. Who fairs best? A. The physical gold hoarder B. The Bitcoin hodler C. The cattle farmer D. The foreign currency trader E. The national currency saver F. The gun and ammo guy
English
@max_entropic @gnoble79 They are industrial development bonds. Saves bond investors tax but it’s not taxpayer funded.
English

@gnoble79 I read in a local paper (Albuquerque Journal) that Dona Ana County in S. New Mexico passed a $165 BILLION municipal bond float to build Data Centers that Oracle has tentatively agreed to LEASE for 17 years
What in the actual f*ck??
English

A bust of epic proportions is coming.
QE Infinity@StealthQE4
It’s amazing to me how Wall St can continually reinvent itself and wreck people using the same tactics over and over and over again. The data center bonds will end up being a disaster just like MBS in 2008. Yields represent risk and the yields are very high. Junk status.
English
@nickrfish @profplum99 @Greenbackd I doubt that "relatively cheap" low growth late stage "value" or no profit shitcos are a good place to hide when equities correct.
English
@nickrfish @profplum99 The problem is its not explicit.
Source. Sender. Receiver.
@Greenbackd says "cheap" and means "relatively cheap". I'm sure 50% off people are thinking "aboslutely cheap".
To me, relatively speaking, valuations are where they should be, considering growth, profit, etc.
English

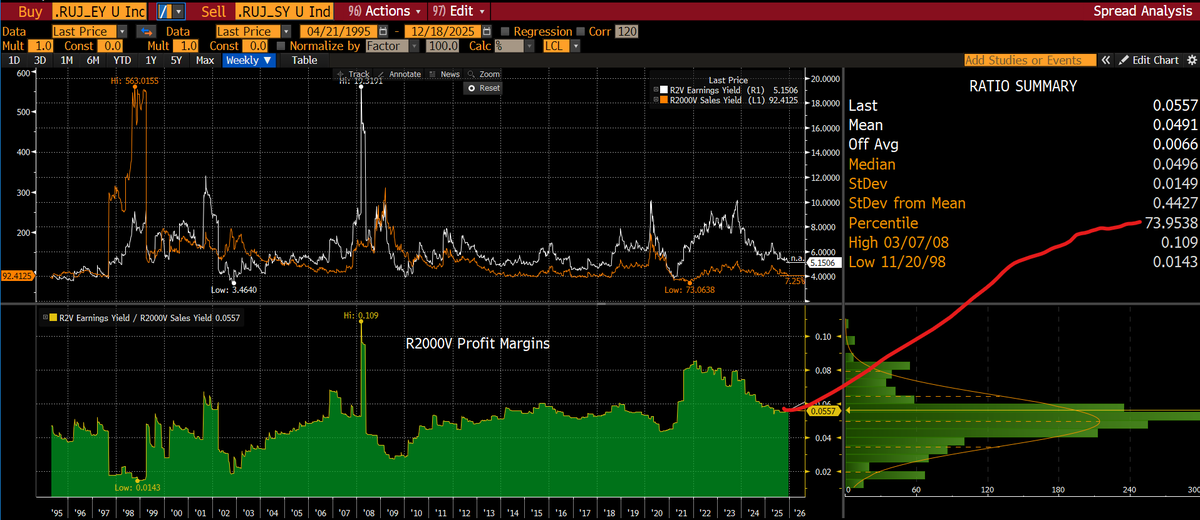
Please make it stop... small cap value is cheap RELATIVELY against the most expensive market in history. Valuations are not remotely reasonable and margins are depressed in only the most absurd context.
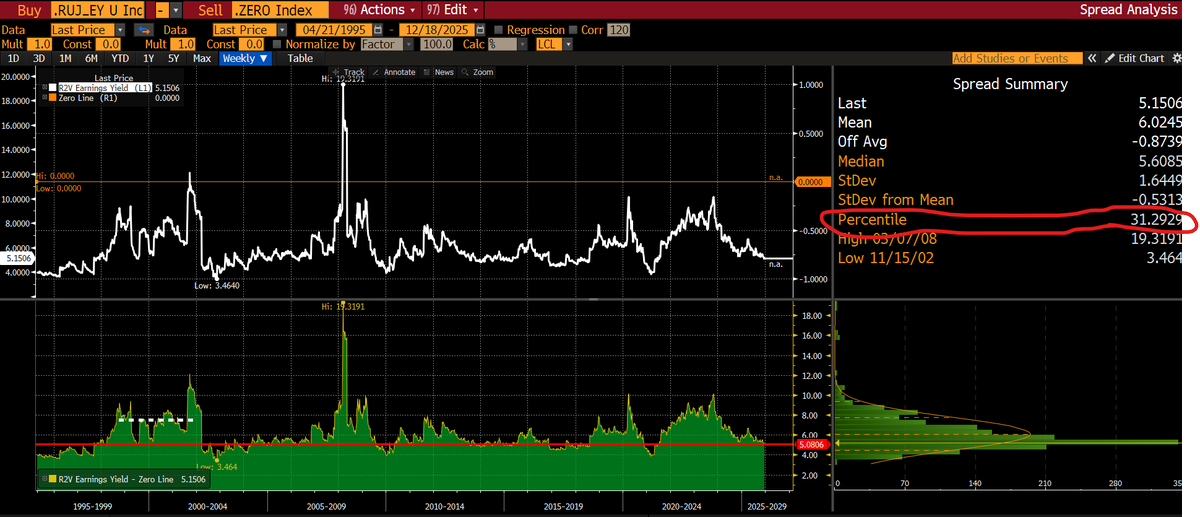
Tobias Carlisle@Greenbackd
Small cap value remains one of the few equity segments with: * Reasonable valuations * Operational leverage to an improving economy * Historically superior forward returns when the Value/Growth spread is wide This Yardeni Research chart plots weekly forward P/E ratios (price divided by next-12-month expected earnings) for: * Russell 2000 (overall) — red * Russell 2000 Growth — blue * Russell 2000 Value — green The values as of Dec 11: * Overall: 25.2x * Growth: 35.2x * Value: 19.3x Scale: P/Es capped at 60 due to COVID-era distortions. Bottom Line 1. Russell 2000 overall looks expensive → weak expected returns 25x forward P/E is historically poor entry territory. 2. Russell 2000 Growth is dangerously overvalued 35x forward P/E + long-duration profile = asymmetric downside, minimal upside. 3. Russell 2000 Value remains the opportunity 19x forward P/E is reasonable, and the valuation spread vs. Growth is near historic extremes—conditions that have historically led to multi-year value factor outperformance. Russell 2000 Value is still near historic lows Value P/E ~19x sounds high, but relative to its history it's: * Near long-term median * Attractive given index-wide distortions from unprofitable companies * Cheap relative to the overall market (S&P 500 forward P/E ~20–22x)
English
@Mr_Neutral_Man @thepupil11 @RecoveryTrade @tsxman They were on Capital Allocators Ep 474 (dec 1). I liked what I heard.
English

They manage over $2 bn. Doesn't look like they own many REITs under $5 bn. Missing out on buyouts of smaller REITs like $ROIC $DRR.UN $ALEX that @RecoveryTrade @thepupil11 @tsxman and have been investing in
Having said that. probably a better risk-adjusted vehicle than investing in private real estate due to how cheap the public REITs are
English
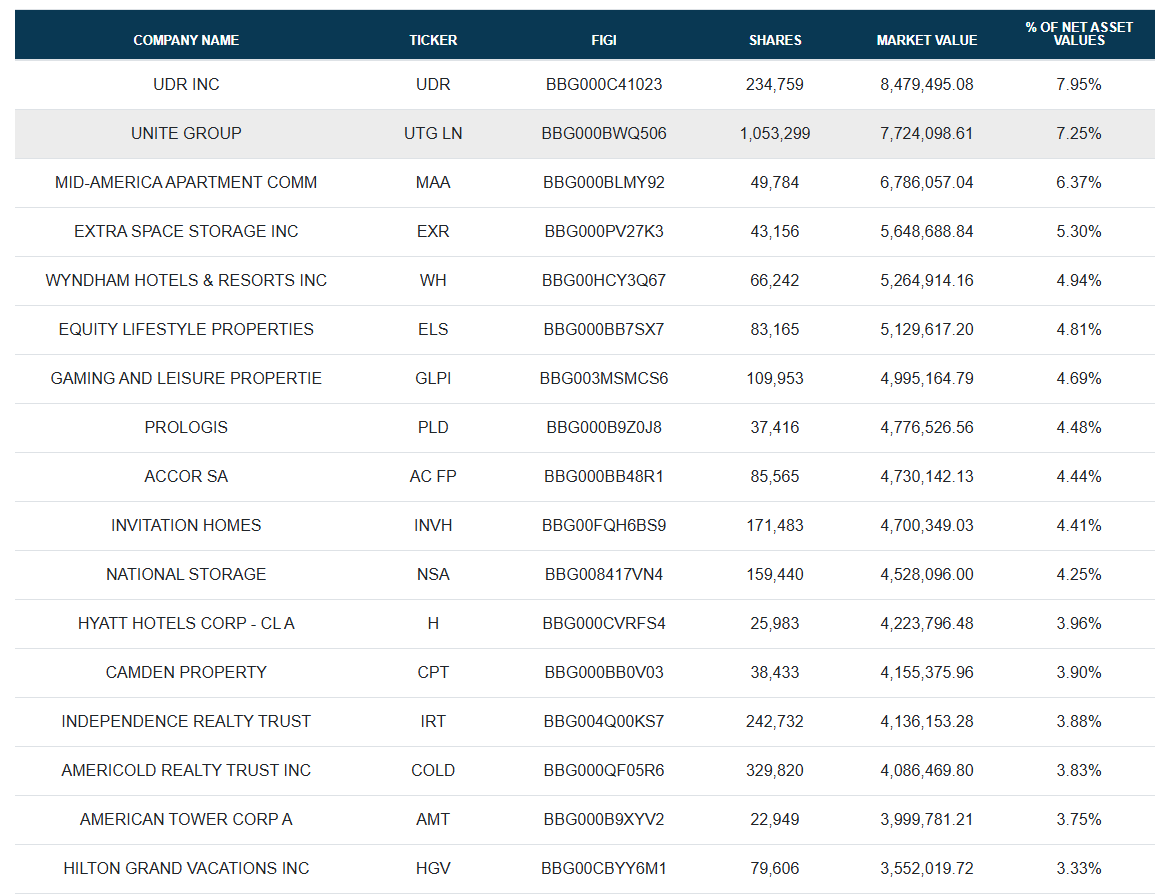
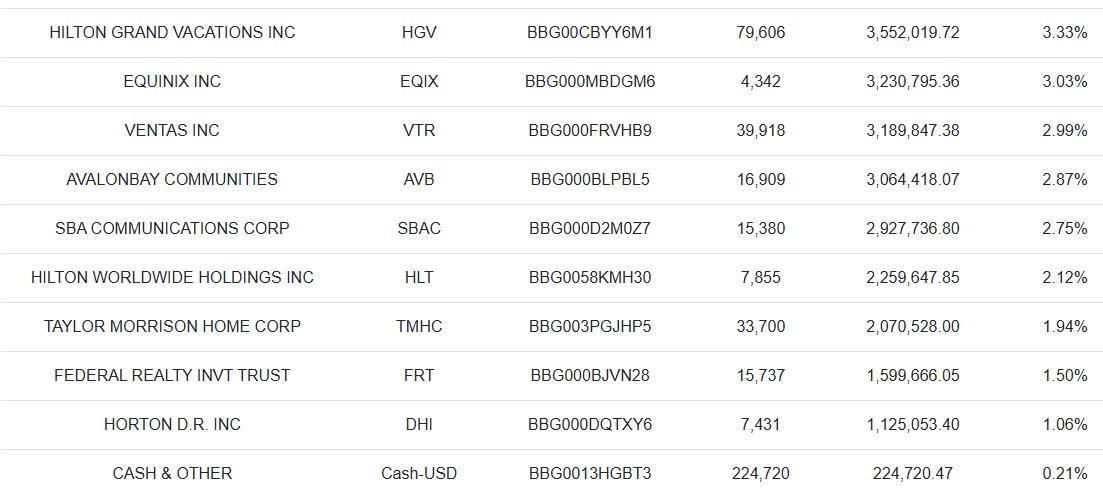
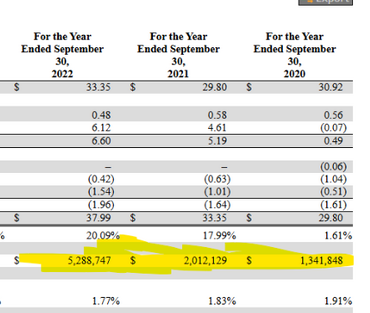
My decision to be so vocal about public REITs recently is largely due to a deep desire to explain that there are public alternatives to real estate (P.A.R.E.)
$BPRE grew AUM from $1.34bn to $5.29 bn at exactly the wrong time to invest in life science, Ouch
HT to @thepupil11
English
Another Lina Khan special:
iRobot - maker of Roomba vacuums - just filed for bankruptcy.
Its leading competitors?
Two Chinese Roomba copycats that are now busy mapping your house.
In 2024, Khan’s FTC asked the EU to block the $AMZN acquisition of iRobot because she knew the block couldn’t happen under U.S. antitrust law.
Why didn’t she like it?
Her child-minded theory that “big is bad,” ipso facto.


English

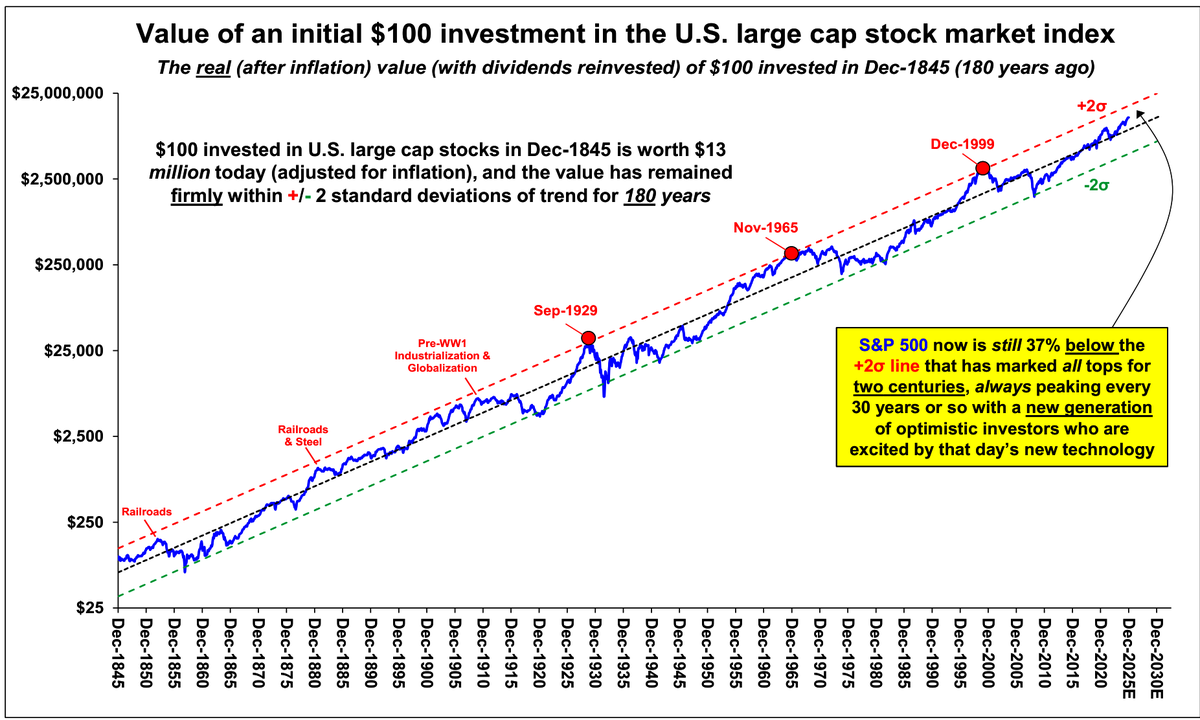
@joemccann Something’s missing between 1999 and now .. can’t quite put my global financial crisis finger on it
English


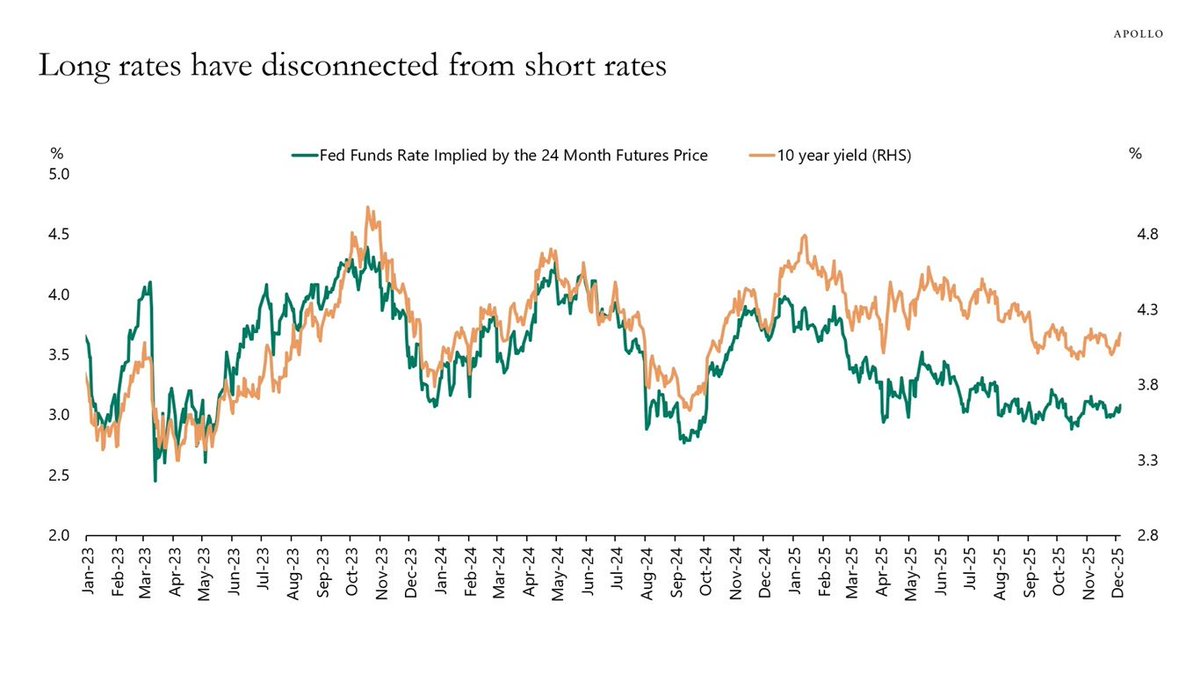
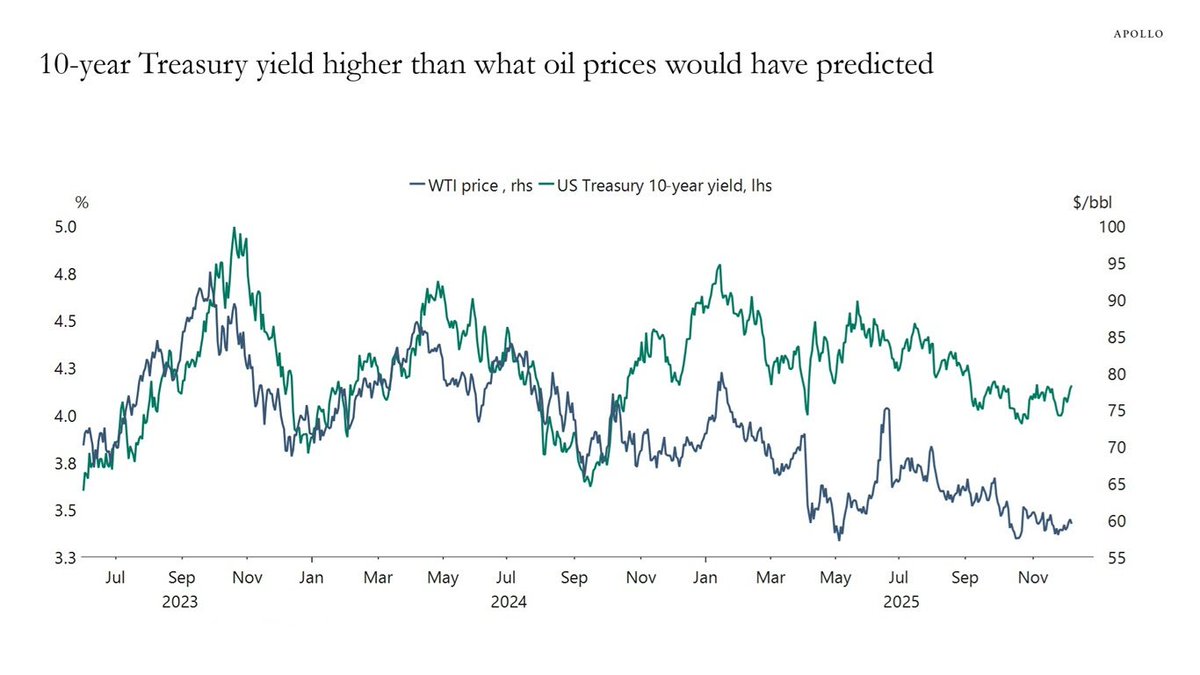
Torsten at Apollo: The yield curve continues to steepen, and investors across all asset classes need to think about why.
This pattern of rising long-term interest rates is highly unusual.


English
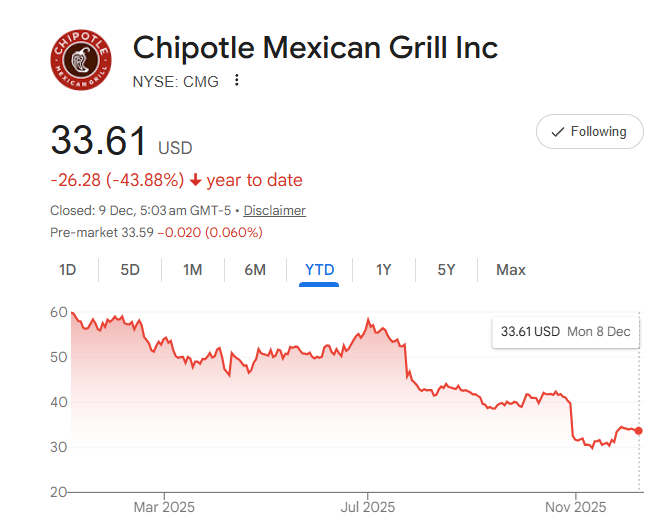
@SteadyCompound It’s expensive and consistently gross (looks dirty-both serving area and tables).
English

Everyone's blaming Chipotle's 44% decline on Slop Bowls.
The real threat? Casual dining.
A former Regional VP who ran 415 restaurants shared what management won't tell you:
English
@JoeCassandra @infraa_ Another way to say it is the ultimate response choice has doubled.
What does that say about what’s going on under the surface?
English

@infraa_ Going from 20 people out of 100k to 40 out of 100k is nowhere near a crisis
English

A CRISIS: 'Deaths of Despair' are Skyrocketing
-Deaths of Despair are now *triple* the rate during the Great Depression
-Deaths of Despair have increased 2.7x since 2000
-Drug overdose deaths are over 5x the rate in 2000
-Alcohol deaths are 4.6x higher than the Great Depression

English

i am begging some of you wannabe finance influencers to spend 6 months on wall street in any capacity whatsoever
English