@airbrushpen @dondadaew Also this is a cartoon at the end of the day set in a fantasy world, some characters can be white who cares
English
lllrtyvlll
4.5K posts


Tried my hand at editing LoK’s Aang design


latinos characters written by latinos are so good, not one mention of their abuela so far


Michael B. Jordan

David Reich on how much ancient DNA evidence has overturned so much consensus thinking how ancient cultures spread. "It wasn't peaceful, it wasn't friendly, it wasn't nice. Some of our archaeologist co-authors were just really distressed."


Chirayu Rana was expelled from high school for pulling a knife on a classmate. He also had a brawl with the school's football coach, and was known rob/mug in the Virginia area.


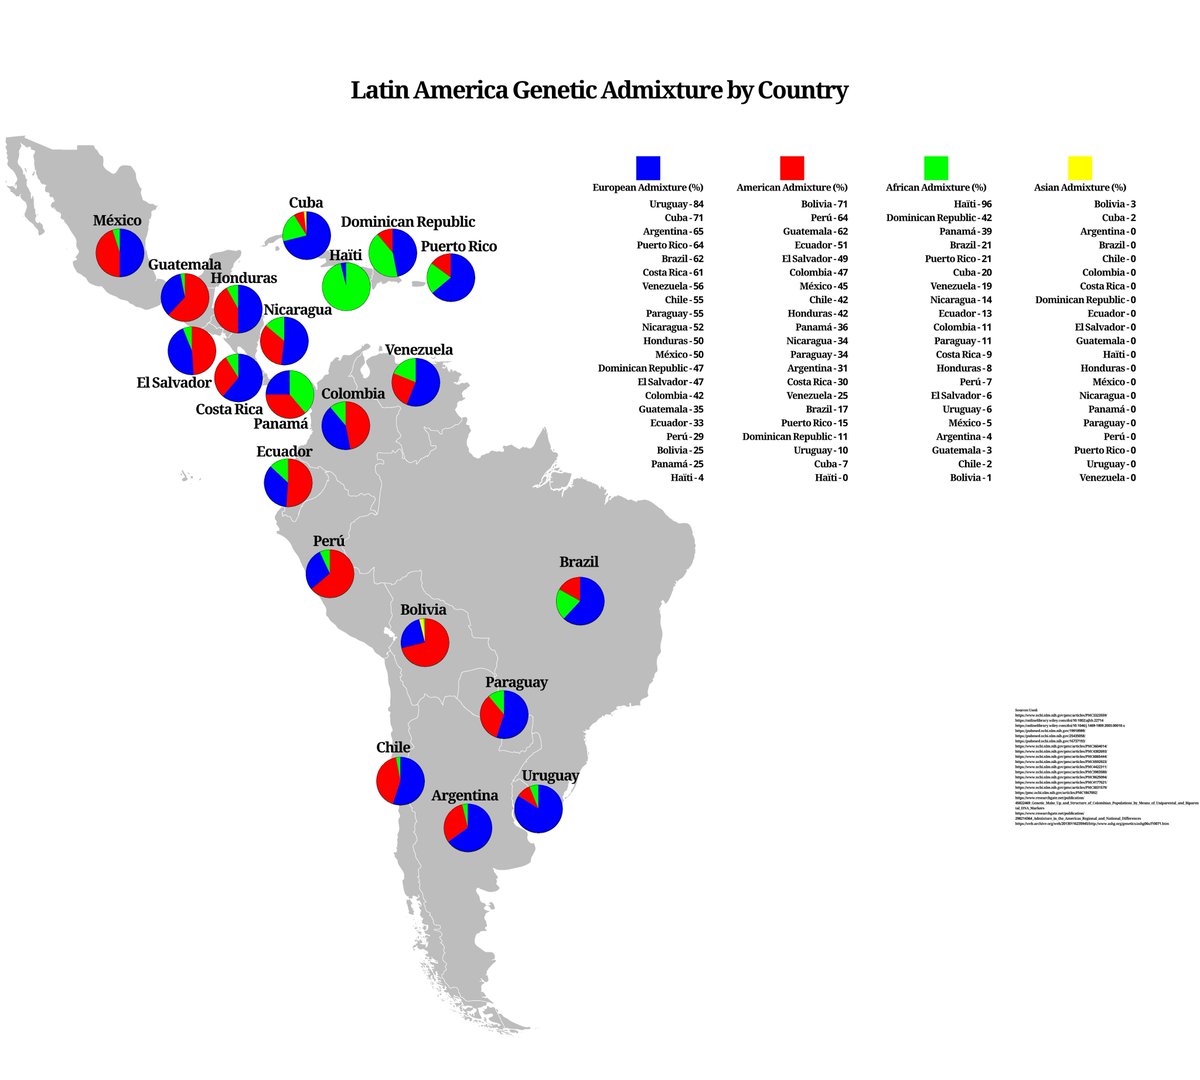
Wignats with Asian fetish will screech at you when you show them data that proves that Arabs, Latin Americans, Indians and Central Asians are closer genetically and yes, culturally to white Europeans than East Asians are even though it's objectively true. Indian Hinduism shares a common origin to ancient Indo-European paganism and Islam is much closer to Christianity than Taoism is. And Latin Americans are literally at least 50-60% European genetically.

This Cato ‘immigrants pay more taxes’ flex + Indian chart is peak cherry-picking. Impressive numbers… until you actually look under the hood. 🧐” 1. It’s median household income, not individual or per-capita — and Indian households are structured differently • The chart (and the “twice as much” claim) uses households, not people. Indian-American households are larger on average (~3.0–3.8 people vs. U.S. average ~2.5) and far more likely to have multiple full-time high earners (dual STEM/medical professionals is common). en.wikipedia. • Indian Americans still have high personal earnings (median ~$85k for ages 16+, ~$106k for full-time workers per 2023 Pew), but the “almost twice” headline evaporates when you adjust for household size and number of workers. This is a classic statistical sleight-of-hand when comparing groups with different living arrangements. 2. Extreme positive selection bias … this is the cream of India’s elite, not “immigrants” in general • Indian Americans aren’t a random sample of India’s 1.4 billion people. The vast majority arrived via H-1B, EB-2/3, or student visas …hyper-selective for advanced degrees and high-skill jobs. You’re comparing the top ~0.1–1% of India’s talent/IQ/education distribution to the broad U.S. average (which includes everyone from McDonald’s workers to retirees). • India’s own per-capita income and education levels are far lower. This doesn’t prove broad immigration is economically magical; it proves cherry-picked high-skill immigration works for the selectees. Second-generation outcomes are strong but show some regression toward the mean, and chain migration/family sponsorship often dilutes the skill level over time. 3. Cato’s overall “immigrants pay more taxes” claim has well-documented methodological holes • Cato (a libertarian think tank that favors more immigration) attributes welfare benefits received by U.S.-born children of immigrants to “natives,” not the immigrant parents. This understates immigrant fiscal costs. The Center for Immigration Studies (CIS) and others note this flips the picture: when you count the full household burden (including kids), immigrant-headed households use welfare at higher rates than native-headed ones. • Cato aggregates all immigrants (high-skill Indians + low-skill groups + illegals). The net positive they find is heavily driven by the high earners. Other studies (National Academies of Sciences, Heritage, etc.) have found first-generation immigrants often impose net costs, especially low-skilled/illegal cohorts. • Their data ends before the post-2021 border surge effects fully hit long-term budgets. 4. H-1B-specific issues (the main pipeline for Indian success) • Many Indian immigrants in tech come via H-1B, which has documented problems: outsourcing/body shops (e.g., Infosys, TCS), wage suppression (foreign workers often paid less for similar roles), and ethnic nepotism once Indians reach management (preferring co-ethnics for hiring/promotions). This displaces U.S. workers and depresses wages in STEM. • Fraud allegations are common (fake credentials, benching workers, etc.). Critics argue this isn’t “adding value” so much as arbitraging cheaper labor and networks. 5. Other drains and context • Remittances: Indian Americans send massive sums back to India (India receives over $100B+ in remittances annually, a huge chunk from the U.S.). That’s money leaving the U.S. economy. • Cost of living: Indians are heavily concentrated in high-cost metros (SF Bay, NYC, etc.), where nominal incomes are inflated anyway. Adjust for purchasing power and the gap shrinks. • The post uses Indian success to defend a general “immigrants = net positive” narrative from Cato. But Indians are ~1.4% of the U.S. population and an outlier. Broad policy implications (more low-skill immigration, open borders, etc.) don’t follow from one high-performing subgroup.


More photos of Allen and his three siblings throughout the years ⬇️